

 ESRI’s chief scientist, Dawn Wright, talks about the importance of the UN Decade of Ocean Science for Sustainable Development, which officially launched in June, and how the company is supporting a number of actions to improve ocean science
Why is the UN Decade of Ocean Science important?
The ocean is under massive threat from climate change, species decline, plastic pollution, and hundreds of other types of polluting debris and toxic chemicals. Humankind is running out of time to start managing this vital resource effectively and sustainably. As time ticks by, the implications for the entire planet are potentially devastating, given that the ocean is our largest ecosystem covering 70% of the planet, is a huge part of the global economy, and is the largest source of the very oxygen that we all breathe (over 50%).
The ocean desperately needs more of our attention. Hence, the UN Decade of Ocean Science for Sustainable Development (www.oceandecade.org) is a once-in-a-lifetime global cooperative program to expand scientific and industry partnerships that will support ground-breaking science, management, conservation, and sustainable development of the ocean. The vision and tagline for the Ocean Decade, which officially began in June and runs until 2030, is “the science we need for the ocean we want.”
The overall mission is to bring to bear transformative ocean science solutions for sustainable development, connecting people and our ocean under seven themes: a clean ocean; a healthy and resilient ocean; a biologically productive ocean; a predicted ocean; a safe ocean; an accessible ocean; and an inspiring and engaging ocean.
For the US specifically, the Ocean Decade presents a tremendous opportunity to play a leadership role in helping to shape the future of ocean and coastal science, along with the future of technology and sustainable development. This is our chance to set the course for ocean science over the next ten years, and beyond. Advancing all these capabilities through domestic and international partnerships enables the US to achieve its goals of safeguarding human health, tackling climate change, ensuring coastal resilience, and promoting economic prosperity. As an example, the Ocean Decade will help strengthen the development and implementation of science-based solutions for storm and weather prediction for public and navigational safety.
 How is Esri supporting it?
For many, many years now Esri has consistently supported a number of UN initiatives and programs, including hosting our annual UN conference (this year in April it was called the “GIS for a Sustainable World Conference”), and the provision of the Open Sustainable Development Goal (SDG) Data Hub, www.sdg.org, which allows the UN to monitor and track progress on all 17 SDGs.
In terms of the Ocean Decade, the Executive Committee issued a call last year for Decade Actions, where partners all over the world were invited to submit proposals requesting endorsement of their programs as transformative Decade Actions. These Decade Actions are meant to give the Ocean Decade real teeth, true implementation rigor, and a huge amount of momentum.
After a thorough review process against the endorsement criteria contained in the Ocean Decade’s Implementation Plan, as well as consideration by the Ocean Decade Advisory Board, more than 60 programs and contributions have been endorsed as the first set of Decade Actions. These Decade Actions were officially announced to the world on June 8. Esri is a participating partner in five of them:
- Deep Ocean Observing Strategy (DOOS), led by the Scripps Institution of Oceanography;
- Digital Twins of the Ocean (DITTO), led by the GEOMAR Helmholtz Center for Ocean Research Kiel and Kiel University;
- Early Career Ocean Professionals (ECOP), led by the Ocean Decade Informal Working Group for Early Career Ocean Professionals;
- Seabed 2030, led by the Nippon Foundation and the General Bathymetric Chart of the Oceans (GEBCO); and
- Promote Seabed 2030 and Ocean Mapping, led by the National Oceanic and Atmospheric Administration (NOAA).
With these programs now officially endorsed, it will be very exciting to actually start the work of building them into a longstanding reality, starting first with initial work plans, project team governance, engagement strategy, etc.
Esri is also a member of the Ocean Decade US Nexus, a program of the US National Ocean Decade Committee of the National Academy of Sciences, to help the Committee share and communicate news about US efforts related to the Ocean Decade. Esri is one of the organizations, that will, through one of our marketing teams, submit our own announcements for posting on the Ocean Decade US website, share announcements from the US National Committee for the Decade with our extensive GIS community, and support the US Ocean Decade social media and public engagement campaigns.
How will a digital twin of the ocean help with ocean/atmosphere monitoring?
A digital twin is a virtual representation of an object, process, or system that bridges the gap between the physical and digital worlds. However, it is more than just a visualization, because when implemented with today’s IoT and AI it can accelerate innovation and ultimately save time and money by iteratively modeling changes, testing how components or systems function, and troubleshooting malfunctions inexpensively within a virtual world.
Therefore, digital twins have become a powerful emerging trend for built environments, such as the next generation of urban planning for smart cities and the digital transformation of business supply chains. Esri has been building and writing about digital twins in the geospatial realm since 2017, especially with regard to ports. We’ve had a longstanding partnership with the Port of Rotterdam which is building a GIS-powered digital twin to provide port managers with a more accurate picture of everything from the weather to how many ships are sailing about, their speed, and where they are headed. Digital simulations of future scenarios within the port will forecast optimal water depths and berth vacancies to pinpoint the best times for ships to berth and offload or take on cargo, all with an eye toward improved efficiency and cost savings.
Certainly, digital twins will be powerful for natural environments such as the ocean, especially as a way to provide more intuitive access to the existing vast stores of ocean data, models, and simulations, including those of air-sea interactions that affect weather and climate. The current ecosystem of ocean-observing platforms, buoys, robots, ships, satellites, allows us to answer the questions, “What is the state of the ocean today? How will it change tomorrow?” But a well-constructed digital twin of the ocean will not only enable a wider range of users to interact with these digital assets, but to explore future scenarios, especially related to human interactions with the ocean (e.g., how will the ocean change depending on certain human actions?).
High-value application areas include fisheries and mariculture, marine protected areas, ocean-based tourism, ecological forecasting, weather forecasting, marine infrastructure development, and the interactions between all of these with an ever-growing collection of data streams. So, the prototypes that we’ll be building as part of the DITTO program for the Ocean Decade mentioned above will help to answer questions such as: “What is the most cost-effective option to mitigate the long-term coastal impact of sea-level rise and the short-term impacts from hurricanes and coastal storms? What is the future of tropical Atlantic upwelling regimes and the implications for coastal commercial fisheries?”
Esri is one of 40 partners from around the world in the DITTO program who will be collaborating on a series of digital twin prototypes for various settings. The prototypes and frameworks that the partners – representing universities, national oceanographic centers, the private sector, and governments – will be building depend on several core elements for their technical infrastructure.
Esri specializes in many of these and thus will be contributing expertise and solutions to the tools that are planned for data ingestion, discovery, and management; tools for spatial analyzing data with classical or AI-based functions, creating what-if scenarios, and visualizing the result in effective 3D and user-friendly environment. Esri is also contributing the existing 3D digital ocean known as the Ecological Marine Units, which includes a 50-year volumetric averages of ocean temperature, salinity, dissolved oxygen, and nutrients.
Have you recently developed any new solutions for ocean monitoring?
The Ecological Marine Units 3D digital ocean is moving into a new phase with the incorporation of the latest version of NOAA’s World Ocean Atlas data.
We have also developed a new High Tide Flooding web application in cooperation with NOAA that promotes the understanding of different sea-level rise scenarios for locations throughout the US.
Another important web app is the new US Vessel Traffic App, which helps marine spatial planners better understand the uses of ocean space and identify potential space-use conflicts. This app allows the user to explore maritime activity, look for patterns, and download manageable subsets of massive AIS (automatic identification system) data feeds.
Understanding the characteristics and metrics for a healthy ocean can go a long way toward promoting sustainable practices and policies by national governments, so we have produced a global dashboard that draws from the Ocean Health Index project of the National Center for Ecological Analysis and Synthesis (NCEAS) and their partners. This dashboard allows for the viewing of country-level statistics about how our coastal oceans are changing over time.
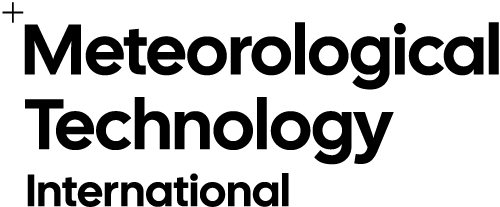
Another ocean monitoring dashboard comes from our collaboration with OceanOps where it’s possible to view the status of 3775 Argo Floats globally. This network of global sensors helps us to better understand the current met-ocean state of our ocean from the air-sea interface down to ~2,000m depth. These Argo floats continually collect in-situ measurements of physical and chemical ocean parameters and transmit the data to shore-based data centers via satellite. The information is absolutely critical for continuous monitoring of the ocean, including the ground-truthing of satellite observations.
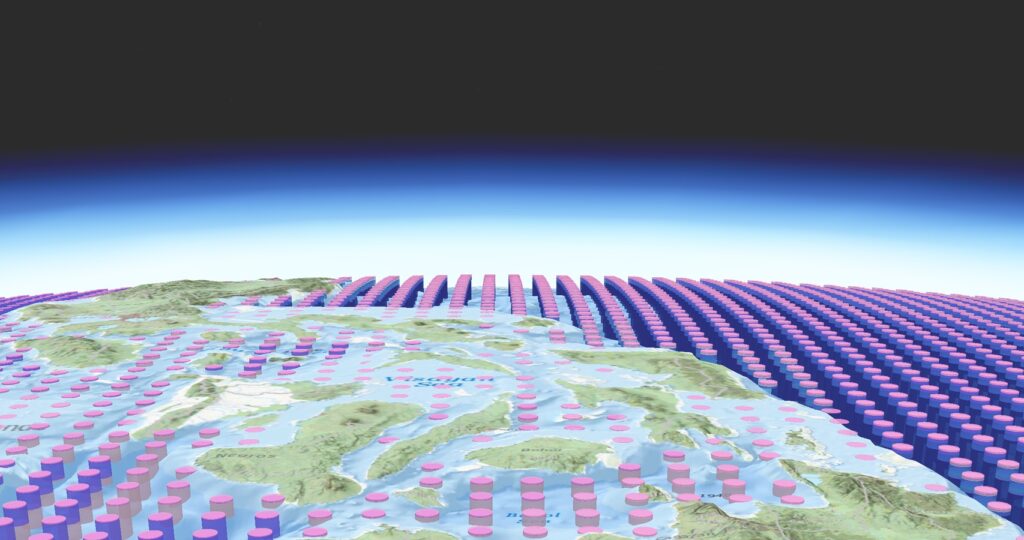
Since the late 1970s, satellites have been used to monitor both the extent and concentration of sea ice around the world. Esri has created the Sea Ice Aware app based on data and analyses of the National Snow and Ice Data Center. The app displays the monthly mean sea-ice extent for both the Arctic and the Antarctic, along with the historical median extent. Additionally, there are dynamic graphs that visualize the minimum and maximum extent for each year, and the monthly time series for each year.
What are the main data gaps in terms of the oceans?
One of the reasons why Seabed 2030 was endorsed as a UN Ocean Decade Action is that we still have only 20.6% of the global ocean floor mapped in a detail similar to maps that we have on land, and because of the great need of these maps for navigational safety, national security, understanding of tsunami inundation and storm surge levels at the coast and other natural hazards, resource exploitation, maritime heritage studies (e.g., shipwrecks), submarine cable and pipeline routing, our understanding of deep ocean circulation in service to climate modeling, and habitats and ecosystems.
As a case in point, the US has the second largest Exclusive Economic Zone (EEZ) in the world, and yet 53% of US waters, including the Great Lakes, remain unmapped by our current technology. The US does have a National Ocean Mapping, Exploration, and Characterization (NOMEC) Strategy to eventually remedy this.
Similarly, we need more ocean observations to better inform our daily, weekly, and seasonal weather forecasts. They are key to improvements in these forecasts, especially for high-impact events such as El Niño, sea-ice minima, hurricanes, and other storms, drought, marine heatwaves, land heat waves, ocean acidification, ocean deoxygenation, and regional weather. Ocean observations, including at depth, are important for initializing the state of the ocean for hurricane prediction (especially intensity) and global sub-seasonal to seasonal (and longer) time scales.
Ocean observations underpin a number of the goals laid out in the Biden Executive Order on Tackling the Climate Crisis at Home and Abroad. And through international, intergovernmental entities such as the Intergovernmental Oceanographic Commission (a body of 150 nations that is overseeing the Ocean Decade), the World Meteorological Organization, and the International Hydrographic Organization, the US is leading the advancement of common standards and frameworks for ocean and marine meteorological observations to enable broader access to information across the world’s oceans.
Does more need to be done to monitor the world’s oceans?
With the data gaps mentioned above, absolutely more needs to be done. And I would say further that the opposite is the case in terms of the atmosphere’s impact on the ocean, given that the ocean absorbs 25% of all atmospheric CO2 emissions, and captures 90% of the additional heat generated from those emissions. So the ocean is in fact buying valuable time for us here on land as the planet careens toward possible catastrophe due to human-induced climate change. The ocean is, in fact, on the front lines and paying the price as ocean storms are becoming more severe, and ocean waters more acidic, damaging marine ecosystems and commercial fish stocks in turn. This is, therefore, one of the main reasons WHY we monitor the ocean to keep conditions from passing a dangerous tipping point.