Meteorological Technology International
  • News
    • A-E
      • Agriculture
      • Automated Weather Stations
      • Aviation
      • Climate Measurement
      • Data
      • Developing Countries
      • Digital Applications
      • Early Warning Systems
      • Extreme Weather
    • G-P
      • Hydrology
      • Lidar
      • Lightning Detection
      • New Appointments
      • Nowcasting
      • Numerical Weather Prediction
      • Polar Weather
    • R-S
      • Radar
      • Rainfall
      • Remote Sensing
      • Renewable Energy
      • Satellites
      • Solar
      • Space Weather
      • Supercomputers
    • T-Z
      • Training
      • Transport
      • Weather Instruments
      • Wind
      • World Meteorological Organization
      • Meteorological Technology World Expo
  • Features
  • Online Magazines
    • April 2025
    • January 2025
    • September 2024
    • April 2024
    • Archive Issues
    • Subscribe Free!
  • Opinion
  • Videos
  • Supplier Spotlight
  • Expo
LinkedIn Twitter Facebook
  • Sign-up for Free Weekly E-Newsletter
  • Meet the Editors
  • Contact Us
  • Media Pack
LinkedIn Facebook
Subscribe
Meteorological Technology International
  • News
      • Agriculture
      • Automated Weather Stations
      • Aviation
      • Climate Measurement
      • Data
      • Developing Countries
      • Digital Applications
      • Early Warning Systems
      • Extreme Weather
      • Hydrology
      • Lidar
      • Lightning Detection
      • New Appointments
      • Nowcasting
      • Numerical Weather Prediction
      • Polar Weather
      • Radar
      • Rainfall
      • Remote Sensing
      • Renewable Energy
      • Satellites
      • Solar
      • Space Weather
      • Supercomputers
      • Training
      • Transport
      • Weather Instruments
      • Wind
      • World Meteorological Organization
      • Meteorological Technology World Expo
  • Features
  • Online Magazines
    1. April 2025
    2. January 2025
    3. September 2024
    4. April 2024
    5. January 2024
    6. September 2023
    7. April 2023
    8. Archive Issues
    9. Subscribe Free!
    Featured
    April 15, 2025

    In this Issue – April 2025

    By Web TeamApril 15, 2025
    Recent

    In this Issue – April 2025

    April 15, 2025

    In this Issue – January 2025

    December 13, 2024

    In this Issue – September 2024

    August 8, 2024
  • Opinion
  • Videos
  • Supplier Spotlight
  • Expo
Facebook LinkedIn
Subscribe
Meteorological Technology International
Aviation

FEATURE: Hurricane Ian flight invents metric for turbulence

Katie Pflaumer, American Meteorological Society’s Front PageBy Katie Pflaumer, American Meteorological Society’s Front PageJune 13, 20246 Mins Read
Share LinkedIn Facebook Twitter Email
As a result of the extreme turbulence experienced by NOAA’s WP-3D Orion Hurricane Hunter aircraft “Kermit” (NOAA42) flight through Hurricane Ian, researchers have created new metrics to better quantify turbulence.
View from NOAA WP-3D Hurricane Hunter aircraft 'Kermit' during flight 20220928H1 into Hurricane Ian. Photo courtesy of Joshua Wadler
Share
LinkedIn Facebook Twitter Email

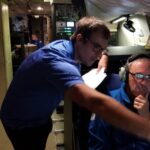
As a result of the extreme turbulence experienced by NOAA’s WP-3D Orion Hurricane Hunter aircraft ‘Kermit’ (NOAA42) flight through Hurricane Ian, researchers have created new metrics to better quantify turbulence. In a study presented in May 2024 by Joshua Wadler of Embry-Riddle Aeronautical University at the 36th Conference on Hurricanes and Tropical Meteorology, the researcher explained that they sought to improve the understanding of turbulence because of its increasingly important global impact given its predicted increase due to climate change.

Video Player
https://blog.ametsoc.org/wp-content/uploads/2024/05/NickUnderwoodHH_Media1.mp4
00:00
00:00
00:00
Use Up/Down Arrow keys to increase or decrease volume.

A bumpiness equation

The flight, which took place on September 28, 2022, reportedly ranked as the top 10 flights in Hurricane Hunter history, and potentially the most turbulent ever on a Hurricane Hunter aircraft, at least in the past 20 years. Metrics for turbulence already exist, but most of those only represent vertical motion and focus on atmospheric properties rather than what happens to occupants. “We wanted… to have a 3D turbulence metric and one that describes the human experience,” said Wadler.

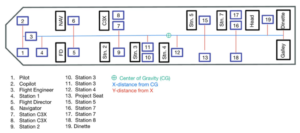
The team highlighted that when an aircraft rapidly accelerates vertically or horizontally, everyone feels the dizzying rise or stomach-clenching drop. However, if the aircraft rotates around its center of gravity in any direction, that acceleration will have different effects depending on where someone is seated. For example, when the aircraft tilts (or pitches) upward the people in the front of the aircraft will feel an upward acceleration while the people in the back will feel a downward acceleration. If the plane is also accelerating upward, such as during take-off, those in the front will experience double the acceleration. As Wadler noted, “Every seat on the plane experiences different rotational motions depending on where you are.”

Left and right: Josh Wadler and colleagues aboard the WP-3D Hurricane Hunter flight into Hurricane Ian, September 28, 2022. Photos courtesy of Jake Barlow. Center: Altius sUAS in front of WP-3D aircraft. Photo: Joe Cione.

The new ‘bumpiness’ metric from Wadler and his colleagues accounts for those differences. The research team combined flight-level data from all P-3 flights since 2004 (when data of a sufficiently high quality became available). They calculated the acceleration forces acting on each seat in the plane relative to the plane’s center of gravity.

The team defined the flight’s bumpiness by combining acceleration with jerk (the rate of change in acceleration over time), accounting for both in all three dimensions. This equation can be applied to any aircraft where the center of gravity and relative positions of the seats are known, and for which high-quality flight-level data is available.

Wadler and colleagues’ equation for defining ‘bumpiness’ (B) in meters per second squared (m/s2)
The off-duty pilot’s bed was thrown from its bunk onto the floor during flight 20220928H1 into Hurricane Ian, due to the lateral motion of the aircraft. Photo courtesy of Jake Barlow

The equation accounts equally for bumpiness in all directions, although it can be thrown off by sharp turns. Missions in which the plane turned sharply on purpose (for example, to calibrate instruments) were excluded from the team’s calculations.

Because the end result, the B or bumpiness value, values all dimensions of movement equally, it doesn’t always sync with what people expect. Some Twitter commenters belittled the video from the flight, possibly because it shows few large up-and-down bumps. The main types of motion experienced by the mission’s crew, however, were front-to-back and side-to-side.

The bumpiest hurricane flights

The researchers calculated the top 10 bumpiest flights for each of the seats on the plane, based on the most turbulent part of each mission.

For the person in seat one (the pilot flying the plane in the front left seat), the Hurricane Ian flight was in fact the bumpiest by far – with a B value of 6.04m/s2, 34% bumpier than any other flight for which good data was available. The second highest B value was experienced during Hurricane Irma in 2017 (B value: 4.5m/s2), the third by a flight into Hurricane Sam in 2021 (B value: 4.39m/s2). Subjective rankings from surveyed flight crews came up with a wide range of answers about their bumpiest flights but were roughly in the same ballpark as those calculated by B value.

Rank Storm Name Mission ID Maximum Bumpiness Value (m/s2)
1 IAN 20220928H1 6.04
2 IRMA 20170908H2 4.50
3 SAM 20210929H2 4.39
4 LANE(EP) 20180822H1 4.28
5 FELIX 20070902H1 4.27
6 DORIAN 20190830H2 4.08
7 PATRICIA(EP) 20151023I1 4.05
8 RAFAEL 20121015H1 4.02
9 GONZALO 20141017I1 3.90
10 DORIAN 20190904H1 3.70

Rankings of B values for Hurricane Hunter flights since 2004, for the pilot in seat 1

Seat map of WP-3D Orion Hurricane Hunter aircraft. Credit: Josh Wadler

On the Hurricane Ian mission, the greatest B value (6.13m/s2) was experienced by the second pilot, sitting in seat two. Wadler was in seat 10. “I was very fearful during this mission,” he noted during his presentation. But, “lo and behold, my seat had the lowest [bumpiness] value by far.” The pilot in seat one experienced 37% worse turbulence than Wadler’s seat in the middle of the plane (6.04m/s2 versus 4.4m/s2).

Seat max Bumpiness (m/s2)
1 6.04
2 6.13
3 6.02
4 5.87
5 5.52
6 5.68
7 5.03
8 5.08
9 4.79
10 4.4
11 4.46
12 4.45
13 4.54
14 4.52
15 4.45
16 4.53
17 4.51
18 4.59
19 4.55

Rankings of B values for all seats on the Hurricane Hunter flight 20220928H1

For seat 1, the Ian flight (Flight 20220928H1) ranked above all other flights for back-front and lateral motion. Yet in terms of up-down motion, a mission during Hurricane Lane ranked far higher, with a vertical B value of 17.1; Ian’s highest vertical B value was 8.43, ranking it seventh in terms of vertical motion. When all metrics are combined, however, the Ian flight came out on top. “It’s normal to have vertical bumps with eyewall updrafts and downdrafts,” Wadler noted in a later conversation, “but the lateral motions are rare. … the dropsondes went all over the cabin.”

Currently, the bumpiness rankings only count the highest B value experienced during a flight. In future work, the research team aims to develop an equation that can account for cumulative bumpiness over time – a ‘queasiness index’ and is well on the way to finding out what flights would make even the most iron-stomached hurricane hunter, in Wadler’s words, “very happy to be on the ground.”

This is a revised version of a post on the American Meteorological Society’s Front Page Blog, authored by Katie Pflaumer.

In related news, NOAA’s National Weather Service (NWS) and GreenSight recently signed a one-year Cooperative Research and Development Agreement to deploy an uncrewed aircraft system, called WeatherHive, to measure atmospheric conditions and evaluate if the data could aid in weather forecasting. Click here to read the full story.

Previous ArticleLow-cost sensors can improve air quality monitoring and people’s health, WMO finds
Next Article University of Oxford uses weather forecasts to measure human impact on extreme weather

Read Similar Stories

Climate Measurement

University of Pennsylvania and Microsoft Research develop machine-learning weather prediction model

May 22, 20257 Mins Read
Climate Measurement

NOAA’s US$3m AI-powered fire detection system undergoes second evaluation

May 21, 20254 Mins Read
Extreme Weather

Ship’s satellite receiver detects landslide-generated tsunami for the first time

May 20, 20254 Mins Read
Latest News

University of Pennsylvania and Microsoft Research develop machine-learning weather prediction model

May 22, 2025

VIDEO: Caltech’s autonomous underwater vehicle harnesses ocean currents to improve ocean monitoring

May 21, 2025

NOAA’s US$3m AI-powered fire detection system undergoes second evaluation

May 21, 2025

Receive breaking stories and features in your inbox each week, for free


Enter your email address:


Supplier Spotlights
  • Palindrome Remote Sensing GmbH
Latest Job Postings
  • Postdoctoral researcher position on land surface and vegetation modelling (R2)

    • Barcelona
    • Barcelona Supercomputing Center - Centro Nacional de Supercomputación
    • Full Time
  • HPC Engineer for Earth Sciences applications (RE1/2)

    • Barcelona
    • Barcelona Supercomputing Center - Centro Nacional de Supercomputación
    • Full Time
Getting in Touch
  • Contact Us / Advertise
  • Meet the Editors
  • Download Media Pack
  • Free Weekly E-Newsletter
Our Social Channels
  • Facebook
  • LinkedIn
© 2025 UKi Media & Events a division of UKIP Media & Events Ltd
  • Cookie Policy
  • Privacy Policy
  • Terms and Conditions
  • Notice and Takedown Policy

Type above and press Enter to search. Press Esc to cancel.

We use cookies on our website to give you the most relevant experience by remembering your preferences and repeat visits. By clicking “Accept”, you consent to the use of ALL the cookies.
Cookie settingsACCEPT
Manage consent

Privacy Overview

This website uses cookies to improve your experience while you navigate through the website. Out of these, the cookies that are categorized as necessary are stored on your browser as they are essential for the working of basic functionalities of the ...
Necessary
Always Enabled

Necessary cookies are absolutely essential for the website to function properly. These cookies ensure basic functionalities and security features of the website, anonymously.

CookieDurationDescription
cookielawinfo-checbox-analytics11 monthsThis cookie is set by GDPR Cookie Consent plugin. The cookie is used to store the user consent for the cookies in the category "Analytics".
cookielawinfo-checbox-functional11 monthsThe cookie is set by GDPR cookie consent to record the user consent for the cookies in the category "Functional".
cookielawinfo-checbox-others11 monthsThis cookie is set by GDPR Cookie Consent plugin. The cookie is used to store the user consent for the cookies in the category "Other.
cookielawinfo-checkbox-necessary11 monthsThis cookie is set by GDPR Cookie Consent plugin. The cookies is used to store the user consent for the cookies in the category "Necessary".
cookielawinfo-checkbox-performance11 monthsThis cookie is set by GDPR Cookie Consent plugin. The cookie is used to store the user consent for the cookies in the category "Performance".
viewed_cookie_policy11 monthsThe cookie is set by the GDPR Cookie Consent plugin and is used to store whether or not user has consented to the use of cookies. It does not store any personal data.

Functional

Functional cookies help to perform certain functionalities like sharing the content of the website on social media platforms, collect feedbacks, and other third-party features.

Performance

Performance cookies are used to understand and analyze the key performance indexes of the website which helps in delivering a better user experience for the visitors.

Analytics

Analytical cookies are used to understand how visitors interact with the website. These cookies help provide information on metrics the number of visitors, bounce rate, traffic source, etc.

Advertisement

Advertisement cookies are used to provide visitors with relevant ads and marketing campaigns. These cookies track visitors across websites and collect information to provide customized ads.

Others

Other uncategorized cookies are those that are being analyzed and have not been classified into a category as yet.

SAVE & ACCEPT
Powered by