Meteorological Technology International
  • News
    • A-E
      • Agriculture
      • Automated Weather Stations
      • Aviation
      • Climate Measurement
      • Data
      • Developing Countries
      • Digital Applications
      • Early Warning Systems
      • Extreme Weather
    • G-P
      • Hydrology
      • Lidar
      • Lightning Detection
      • New Appointments
      • Nowcasting
      • Numerical Weather Prediction
      • Polar Weather
    • R-S
      • Radar
      • Rainfall
      • Remote Sensing
      • Renewable Energy
      • Satellites
      • Solar
      • Space Weather
      • Supercomputers
    • T-Z
      • Training
      • Transport
      • Weather Instruments
      • Wind
      • World Meteorological Organization
      • Meteorological Technology World Expo
  • Features
  • Online Magazines
    • April 2023
    • September 2022
    • April 2022
    • September 2021
    • Archive Issues
    • Subscribe Free!
  • Opinion
  • Videos
  • Supplier Spotlight
  • Jobs
    • Browse Industry Jobs
    • Post a Job – It’s FREE!
    • Manage Jobs (Employers)
LinkedIn Twitter Facebook
  • Sign-up for Free Weekly E-Newsletter
  • Meet the Editors
  • Contact Us
  • Media Pack
LinkedIn Facebook
Subscribe
Meteorological Technology International
  • News
      • Agriculture
      • Automated Weather Stations
      • Aviation
      • Climate Measurement
      • Data
      • Developing Countries
      • Digital Applications
      • Early Warning Systems
      • Extreme Weather
      • Hydrology
      • Lidar
      • Lightning Detection
      • New Appointments
      • Nowcasting
      • Numerical Weather Prediction
      • Polar Weather
      • Radar
      • Rainfall
      • Remote Sensing
      • Renewable Energy
      • Satellites
      • Solar
      • Space Weather
      • Supercomputers
      • Training
      • Transport
      • Weather Instruments
      • Wind
      • World Meteorological Organization
      • Meteorological Technology World Expo
  • Features
  • Online Magazines
    1. September 2023
    2. April 2023
    3. September 2022
    4. April 2022
    5. Archive Issues
    6. Subscribe Free!
    Featured
    August 10, 2023

    In this Issue – September 2023

    By Web TeamAugust 10, 2023
    Recent

    In this Issue – September 2023

    August 10, 2023

    In this Issue – April 2023

    April 18, 2023

    In this Issue – September 2022

    August 12, 2022
  • Opinion
  • Videos
  • Supplier Spotlight
  • Jobs
    • Browse Industry Jobs
    • Post a Job – It’s FREE!
    • Manage Jobs (Employers)
Facebook LinkedIn
Meteorological Technology International
Data

NOAA updates mapping tool to illustrate disaster risk and vulnerability at a community level

Dan SymondsBy Dan SymondsJuly 28, 20223 Mins Read
Share LinkedIn Facebook Twitter Email
Share
LinkedIn Facebook Twitter Email

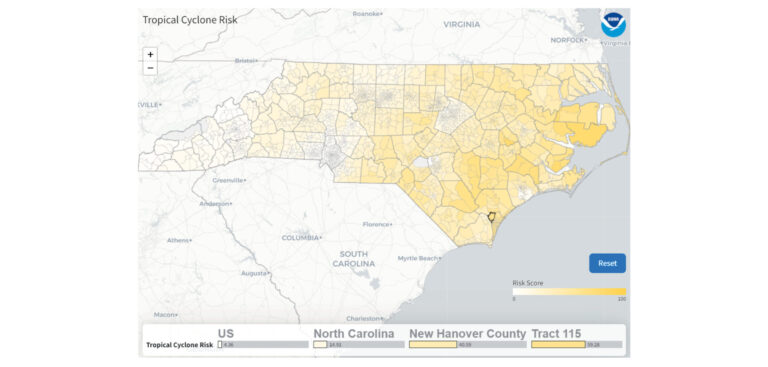
The National Oceanic and Atmosphere Administration (NOAA) has launched a comprehensive update to its Billion Dollar Disasters mapping tool, which now includes US census tract data to provide community-level awareness of hazard risk, exposure and vulnerability across more than 100 combinations of weather and climate hazards.

The enhanced interactive maps from NOAA’s National Centers for Environmental Information (NCEI) cover all 50 states and the District of Columbia, and provide data for more than 72,000 US census tracts, which are small subdivisions of counties that average around 4,000 inhabitants. Users can now visualize a community’s combined physical exposure, socioeconomic vulnerability, and markers of resilience to natural hazards on a finer scale than ever before.

Dr Rick Spinrad, NOAA administrator, said, “The updated tool will provide a better understanding of how weather, ocean and climate disasters impact many Americans at the community level, and help guide targeted preparation and mitigation efforts as we build a climate-ready nation. This hyper-local information advances NOAA’s vision for resilient communities and economies, and will strengthen our support for vulnerable populations that face outsized weather, ocean and climate risks.”

The census tract data builds on county-level data added to the mapping tool last year. The weather and climate hazards displayed through the tool include severe storms and tornadoes; drought events and heatwaves; hurricanes and tropical storms; wildfires; river-basin and urban flooding; and winter storms, freeze events and cold waves.

Robert L Santos, director, US Census Bureau, said, “This tool helps the public better understand potential impacts of disasters on the American people and our economy. It illustrates how combining resources from the Census Bureau and NOAA can advance each agency’s mission. We are pleased to see American Community Survey data being used in this new tool. We’re excited to collaborate with NOAA in the future on enhancements to the tool that incorporate even more of our data.”
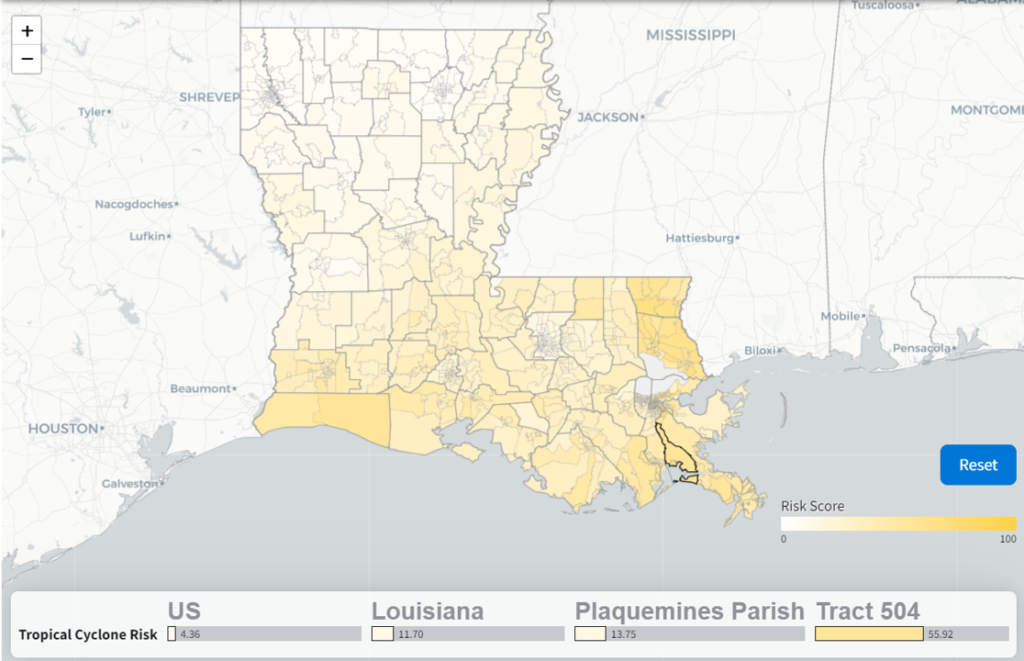
The new maps also provide select socioeconomic vulnerability information using the CDC Social Vulnerability Index, which is derived from the Census Bureau’s American Community Survey data. There are numerous factors found in the census tract data that can indicate potential vulnerability, including: socioeconomic status; household composition and disability status; minority status and language; and housing type and transportation availability.

Examining this information can help to identify areas where both risk exposure and socioeconomic vulnerability is high. Decision-makers can then use this information to better understand where to focus hazard mitigation planning and investment, especially in areas where resources are sparse.

Adam Smith, billion-dollar disaster expert for NOAA NCEI, said, “This mapping tool helps people understand the risk of weather and climate disasters where they live, at a time when we’re seeing more costly extreme weather events. For example, a user can explore multiple hazard risks, such as the cascading impacts of drought, wildfire and flooding on vulnerable populations in the US Southwest or see how combined hurricane, flooding and severe storm events across the Gulf coast could severely impact their neighborhood.”

The new tool comes at a time when the number and cost of billion-dollar disasters in the USA are rising. Since January of 2020, the nation has experienced 51 separate billion-dollar weather and climate disasters, which totaled more than US$275bn in damages and killed nearly 1,000 people. From January to June 2022, the USA has already been affected by nine separate billion-dollar disasters.

Previous ArticleNASA unveils contractors to undertake definition-phase studies for NOAA’s GeoXO satellites
Next Article BoM begins upgrades to Darwin’s main weather radar

Read Similar Stories

Climate Measurement

EMS and AMS renew collaboration agreement

September 25, 20231 Min Read
Climate Measurement

Major methane leak in the UK detected using satellites

September 22, 20232 Mins Read
Extreme Weather

Record-breaking wildfires throughout the 2023 boreal wildfire season

September 18, 20233 Mins Read
Latest News

EMS and AMS renew collaboration agreement

September 25, 2023

Major methane leak in the UK detected using satellites

September 22, 2023

NCAS trials use of biofuel to power storm-tracking weather radar

September 22, 2023

Receive breaking stories and features in your inbox each week, for free


Enter your email address:


Supplier Spotlights
  • Baron
Getting in Touch
  • Contact Us / Advertise
  • Meet the Editors
  • Download Media Pack
  • Free Weekly E-Newsletter
Our Social Channels
  • Facebook
  • LinkedIn
© 2023 UKi Media & Events a division of UKIP Media & Events Ltd
  • Cookie Policy
  • Privacy Policy
  • Terms and Conditions
  • Notice and Takedown Policy

Type above and press Enter to search. Press Esc to cancel.

We use cookies on our website to give you the most relevant experience by remembering your preferences and repeat visits. By clicking “Accept”, you consent to the use of ALL the cookies.
Cookie settingsACCEPT
Manage consent

Privacy Overview

This website uses cookies to improve your experience while you navigate through the website. Out of these, the cookies that are categorized as necessary are stored on your browser as they are essential for the working of basic functionalities of the website. We also use third-party cookies that help us analyze and understand how you use this website. These cookies will be stored in your browser only with your consent. You also have the option to opt-out of these cookies. But opting out of some of these cookies may affect your browsing experience.
Necessary
Always Enabled

Necessary cookies are absolutely essential for the website to function properly. These cookies ensure basic functionalities and security features of the website, anonymously.

CookieDurationDescription
cookielawinfo-checbox-analytics11 monthsThis cookie is set by GDPR Cookie Consent plugin. The cookie is used to store the user consent for the cookies in the category "Analytics".
cookielawinfo-checbox-functional11 monthsThe cookie is set by GDPR cookie consent to record the user consent for the cookies in the category "Functional".
cookielawinfo-checbox-others11 monthsThis cookie is set by GDPR Cookie Consent plugin. The cookie is used to store the user consent for the cookies in the category "Other.
cookielawinfo-checkbox-necessary11 monthsThis cookie is set by GDPR Cookie Consent plugin. The cookies is used to store the user consent for the cookies in the category "Necessary".
cookielawinfo-checkbox-performance11 monthsThis cookie is set by GDPR Cookie Consent plugin. The cookie is used to store the user consent for the cookies in the category "Performance".
viewed_cookie_policy11 monthsThe cookie is set by the GDPR Cookie Consent plugin and is used to store whether or not user has consented to the use of cookies. It does not store any personal data.

Functional

Functional cookies help to perform certain functionalities like sharing the content of the website on social media platforms, collect feedbacks, and other third-party features.

Performance

Performance cookies are used to understand and analyze the key performance indexes of the website which helps in delivering a better user experience for the visitors.

Analytics

Analytical cookies are used to understand how visitors interact with the website. These cookies help provide information on metrics the number of visitors, bounce rate, traffic source, etc.

Advertisement

Advertisement cookies are used to provide visitors with relevant ads and marketing campaigns. These cookies track visitors across websites and collect information to provide customized ads.

Others

Other uncategorized cookies are those that are being analyzed and have not been classified into a category as yet.

SAVE & ACCEPT
Powered by