Close Menu
Meteorological Technology International
  • News
    • A-E
      • Agriculture
      • Automated Weather Stations
      • Aviation
      • Climate Measurement
      • Data
      • Developing Countries
      • Digital Applications
      • Early Warning Systems
      • Extreme Weather
    • G-P
      • Hydrology
      • Lidar
      • Lightning Detection
      • New Appointments
      • Nowcasting
      • Numerical Weather Prediction
      • Polar Weather
    • R-S
      • Radar
      • Rainfall
      • Remote Sensing
      • Renewable Energy
      • Satellites
      • Solar
      • Space Weather
      • Supercomputers
    • T-Z
      • Training
      • Transport
      • Weather Instruments
      • Wind
      • World Meteorological Organization
      • Meteorological Technology World Expo
  • Features
  • Online Magazines
    • January 2026
    • April 2025
    • January 2025
    • September 2024
    • April 2024
    • Archive Issues
    • Subscribe Free!
  • Opinion
  • Videos
  • Supplier Spotlight
  • Expo
LinkedIn X (Twitter) Facebook
  • Sign-up for Free Weekly E-Newsletter
  • Meet the Editors
  • Contact Us
  • Media Pack
LinkedIn Facebook
Subscribe
Meteorological Technology International
  • News
      • Agriculture
      • Automated Weather Stations
      • Aviation
      • Climate Measurement
      • Data
      • Developing Countries
      • Digital Applications
      • Early Warning Systems
      • Extreme Weather
      • Hydrology
      • Lidar
      • Lightning Detection
      • New Appointments
      • Nowcasting
      • Numerical Weather Prediction
      • Polar Weather
      • Radar
      • Rainfall
      • Remote Sensing
      • Renewable Energy
      • Satellites
      • Solar
      • Space Weather
      • Supercomputers
      • Training
      • Transport
      • Weather Instruments
      • Wind
      • World Meteorological Organization
      • Meteorological Technology World Expo
  • Features
  • Online Magazines
    1. April 2026
    2. January 2026
    3. September 2025
    4. April 2025
    5. January 2025
    6. September 2024
    7. April 2024
    8. January 2024
    9. Archive Issues
    10. Subscribe Free!
    Featured
    May 5, 2026

    In this Issue – April 2026

    By Web TeamMay 5, 2026
    Recent

    In this Issue – April 2026

    May 5, 2026

    In this Issue – January 2026

    November 27, 2025

    In this Issue – September 2025

    August 11, 2025
  • Opinion
  • Videos
  • Supplier Spotlight
  • Expo
Facebook LinkedIn
Subscribe
Meteorological Technology International
Data

ECMWF returns to Mode-S aircraft observations to improve forecasts

Elizabeth BakerBy Elizabeth BakerJanuary 24, 20244 Mins Read
Share LinkedIn Facebook Twitter Email
Share
LinkedIn Facebook Twitter Email

ECMWF has started to use Mode-S aircraft observations again to improve the quality of forecasts. The use of Mode-S data was suspended in November 2022 when it became evident that the rapid increase in data volumes following the Covid-19 pandemic would require the development of mechanisms to control data density.

The aircraft observations of wind and temperature are used together with many other types of observations to estimate the state of the Earth system at the start of forecasts, known as the analysis. At ECMWF, aircraft reports are reportedly second only to satellite data in their impact on forecasts.

The aircraft reports come from different sources: in addition to data from the WMO’s Aircraft Meteorological Data Relay (AMDAR) program and a small number of other data, in July 2020 ECMWF started to assimilate Mode-S data over Europe.

Mode-S data is derived from air traffic control data. ECMWF points out that this data is not originally intended for meteorological use and needs to be processed to make it usable. For example, it includes the speed of the aircraft relative to the air. From that, with the positions of the aircraft a few minutes apart, the wind can be determined. That work is performed by the Royal Netherlands Meteorological Institute (KNMI). ECMWF uses the data that has been processed by KNMI.

Over Europe, about 100 times more data is available from Mode-S than from AMDAR. ECMWF used only about 5% of the Mode-S data in 2020. However, as data volumes increased after Covid-19 measures ended, the data assimilation system to process the observations was overburdened.

ECMWF’s 4D-Var data assimilation system starts from a previous short-term forecast and iterates to produce an analysis that is closer to the latest weather observations. It was found that the procedure did not produce optimal results for the large number of Mode-S observations used after Covid-19, in the limited time available. With a smaller number of Mode-S observations, on the other hand, the impact on forecasts became positive again. The new system was introduced in November 2023 after no Mode-S data had been used for 12 months. It includes a new method of thinning the data.

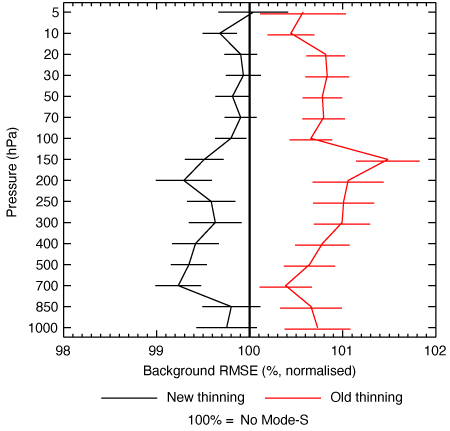
“In the previous system, individual aircraft tracks were considered and time thinning was applied to them,” said Bruce Ingleby, a scientist at ECMWF. “This led to too much data overall. The new system uses ‘box thinning’ – the atmosphere is divided into boxes, and just one aircraft report is used for each box.”

At short range, upper tropospheric winds over Europe are reportedly up to 8% better. ECMWF highlighted that the impact of using a smaller number of Mode-S observations, with a new thinning method, is particularly clear when compared with using no Mode-S data. This is shown below for temperature observations.

This graph shows the impact of using the previous aircraft thinning in the summer of 2022 in red, and that of the new aircraft thinning in black, against the vertical 100% line, which represents no use of Mode-S data. It shows that the root-mean-square error (RMSE) of short-term forecasts (the ‘background’) is reduced by the new use of Mode-S data across all pressure levels, while it was increased by the previous use of Mode-S data. The graph covers data from June 1 to August 31, 2022 in the northern hemisphere compared with radiosonde temperature data. The horizontal lines are 95% confidence intervals

“This example shows the importance of constant vigilance when monitoring the global observing system. Not just the quality of observations but also data numbers are having an impact upon the analysis and forecasts,” Ingleby said. “In this case, there was nothing wrong with the observations, we were simply using too many of them.”

Thanks to the UK Met Office and KNMI, ECMWF will have access to global Mode-S data in the near future – a particularly exciting prospect is the availability of more wind data in the tropics.

To find out more about ECMWF’s latest developments, click here.

Previous ArticleWMO experts discuss action on water and early warnings
Next Article AEM releases its 2023 US lightning report

Read Similar Stories

Climate Measurement

Global warming reached 1.37°C in 2025 as heat accumulation hits record rate

June 12, 20263 Mins Read
Climate Measurement

Cambridge AI tool converts satellite archives into accessible Earth intelligence

June 10, 20262 Mins Read
Solar

IKEA uses 20 years of solar data to identify Sweden’s sunniest square meter

June 8, 20262 Mins Read
Latest News

NOAA’s SOLAR-1 satellite becomes operational, boosting space weather forecasting capability

June 16, 2026

Global warming reached 1.37°C in 2025 as heat accumulation hits record rate

June 12, 2026

NSF NCAR researchers develop advanced model for neighborhood-scale low-altitude wind prediction

June 11, 2026

Receive breaking stories and features in your inbox each week, for free


Enter your email address:


Supplier Spotlights
  • MicroStep-MIS
Getting in Touch
  • Contact Us / Advertise
  • Meet the Editors
  • Media Pack
  • Free Weekly E-Newsletter
Our Social Channels
  • Facebook
  • LinkedIn
© 2026 UKi Media & Events a division of UKIP Media & Events Ltd
  • Cookie Policy
  • Privacy Policy
  • Terms and Conditions
  • Notice and Takedown Policy

Type above and press Enter to search. Press Esc to cancel.