


In February 2019 a weather phenomenon known as an atmospheric river (AR) occurred in the eastern Pacific. An AR is a narrow corridor of concentrated moisture in the atmosphere – like a river in the sky. When it made landfall it dumped massive volumes of rain on to the US west coast, leading to flooding and landslides in California. In its aftermath a team of scientists comprising meteorologists and computer scientists from NOAA and the University of Maryland decided to simulate the AR event in virtual reality (VR).
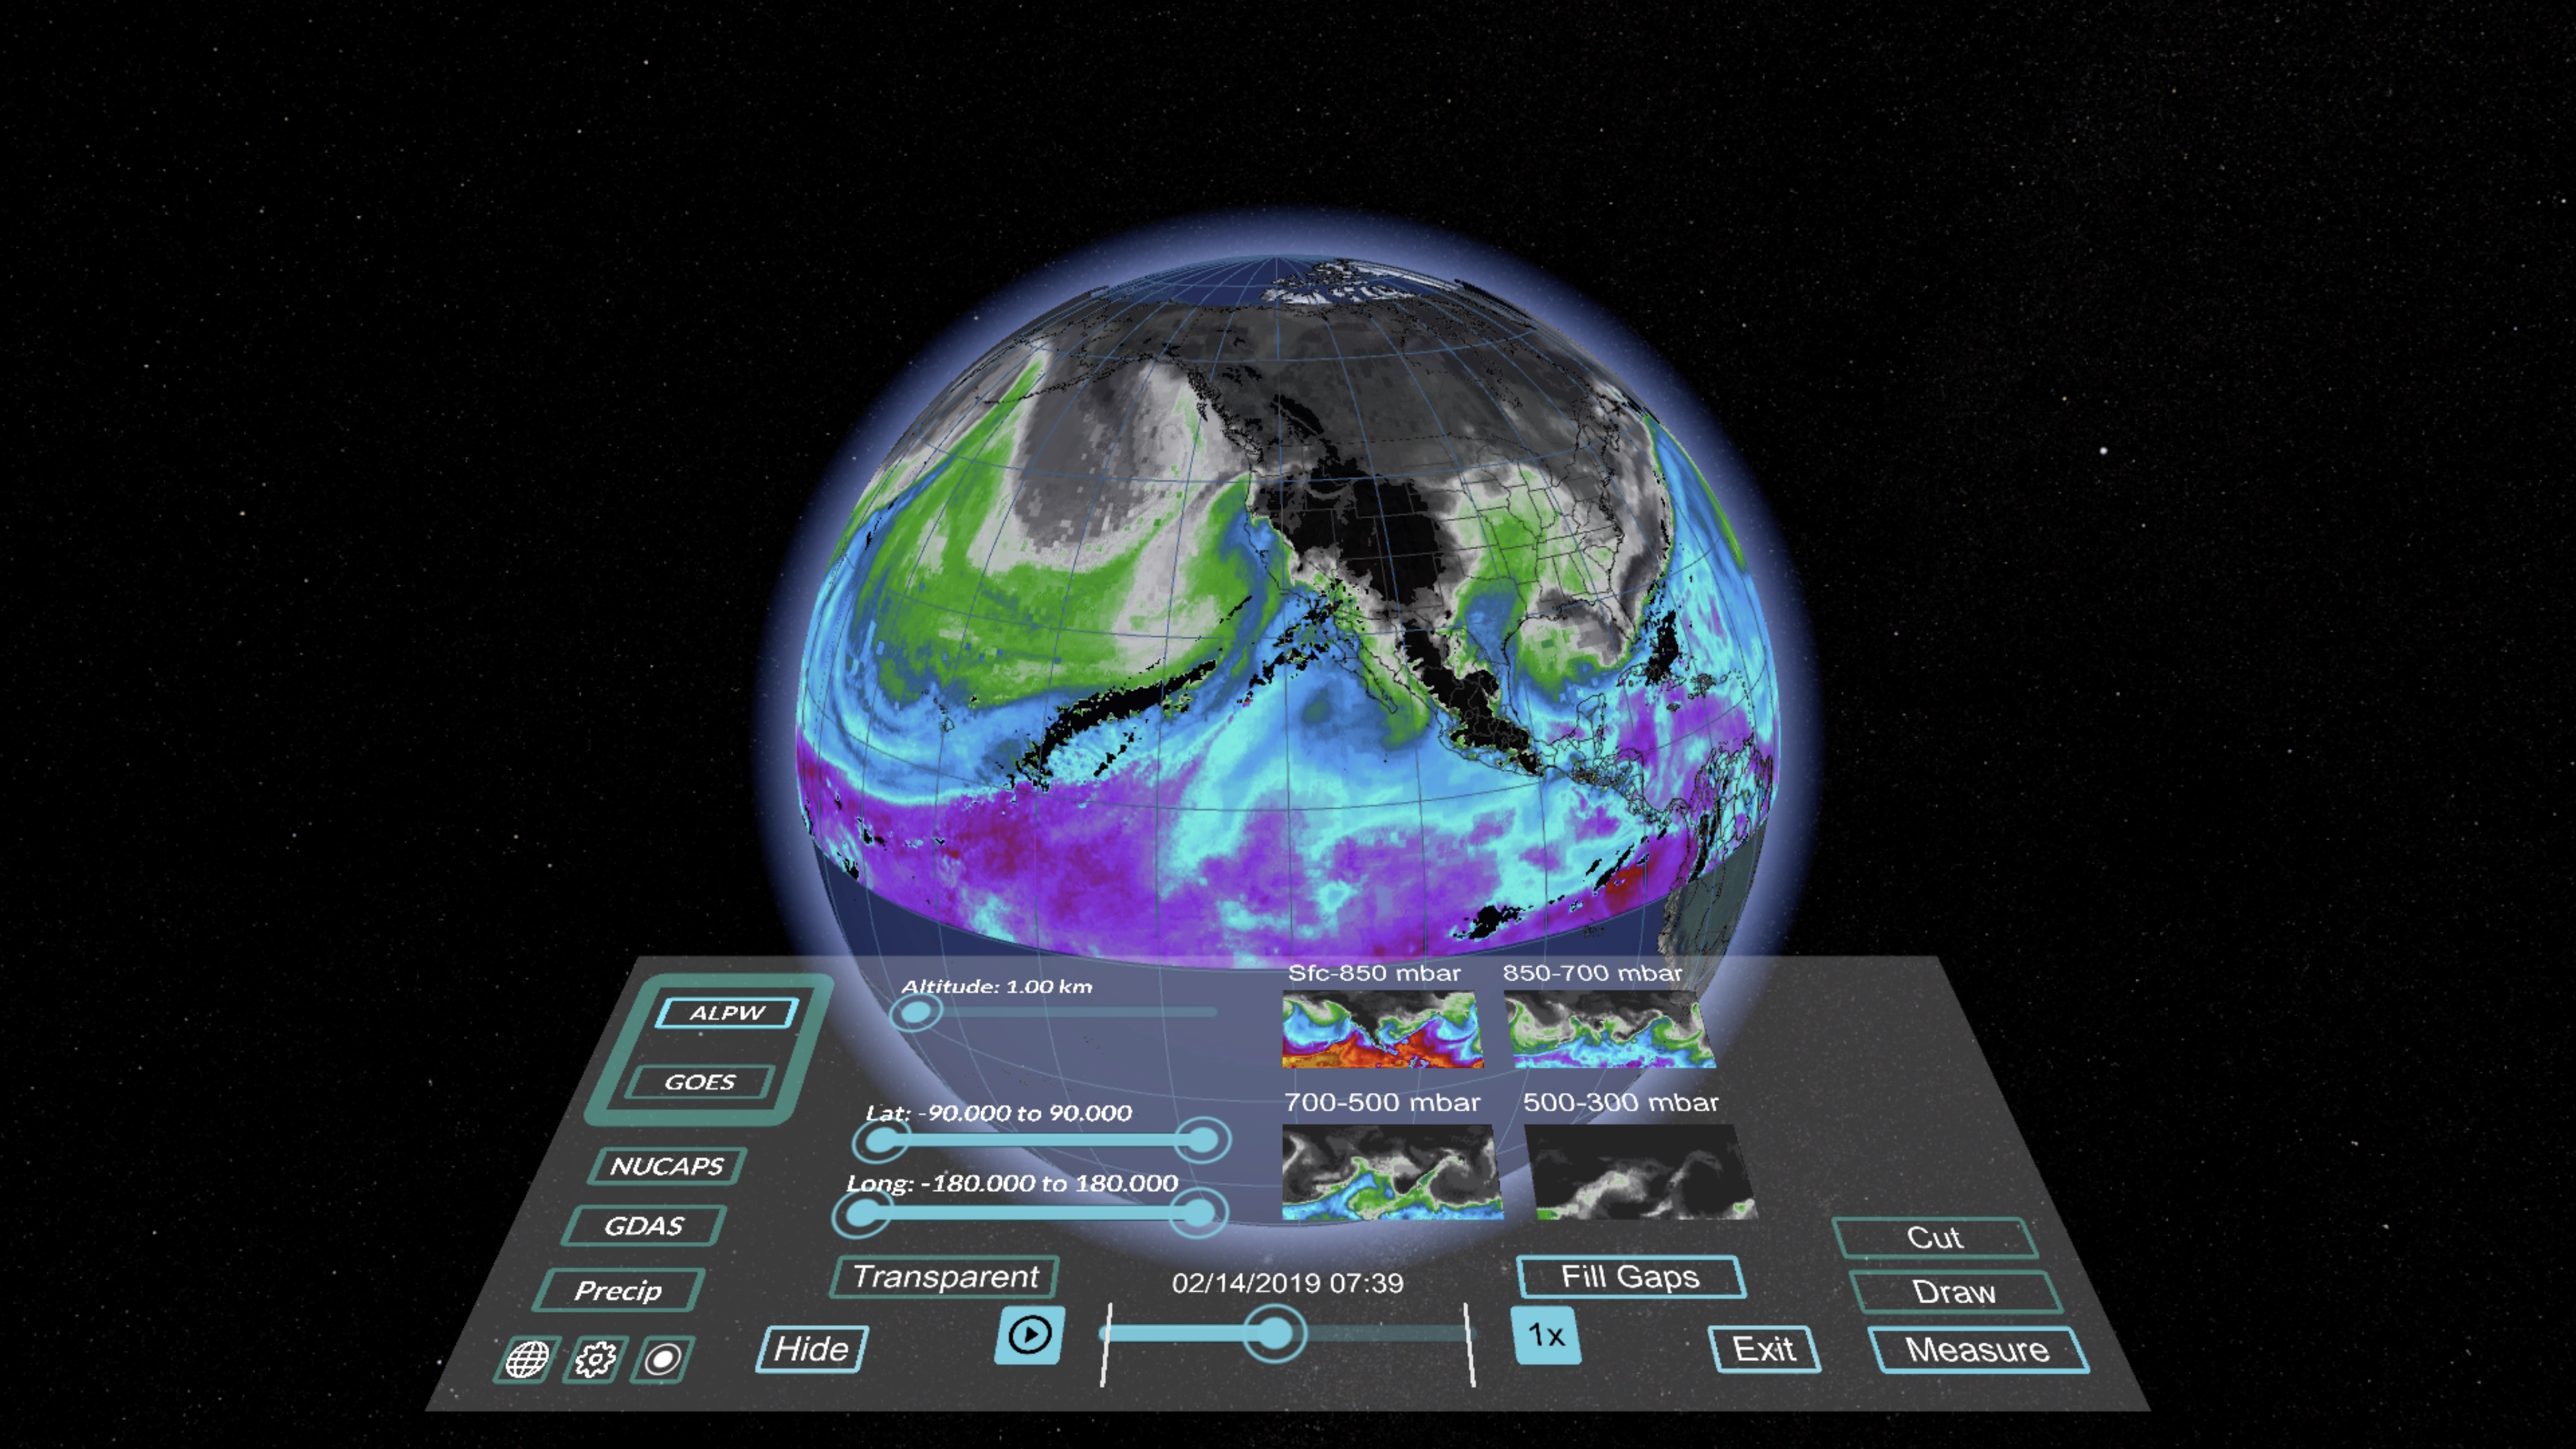
To do this they ran raw data from the AR event through a VR software tool they had created known as MeteoVis. A video of their results can be viewed on YouTube. While viewing it this way is somewhat limiting,
as you miss out on the fully immersive 3D experience of seeing it through a VR headset, the video nonetheless offers a showcase of the potential for VR in meteorology.
“What’s important in an AR event is the precipitable water – the amount of moisture at different layers,” says Scott Rudlosky, a physical scientist in the satellite climate studies branch of the NOAA and part of the MeteoVis team. “Forecasters can see visuals of that with our current system, but what’s neat about the VR is that you can overlay the wind with that moisture. So you can say, ‘Okay, not only is there a big plume of moisture, but it’s moving and the winds are strengthening and there’s going to be more moisture transport.’”
Improved visualization
This ability to display multiple weather phenomenon together is one of the biggest advantages VR offers over current weather visualization tools, according to Peter Bauer who is deputy director of research at the European Centre for Medium-Range Weather Forecasts (ECMWF) in the UK.
“It allows you to learn a lot more about the model, you can actually see how the processes that you simulate interplay and whether that is realistic or not,” says Bauer.
Most current weather visualization tools – the Advanced Weather Interactive Processing System (AWIPS) used by NOAA, for example – display data sets in a two-dimensional field. This is despite the fact that most of the data sets themselves are 3D, notes Peter Messmer, principal devtech engineer at AI company Nvidia.
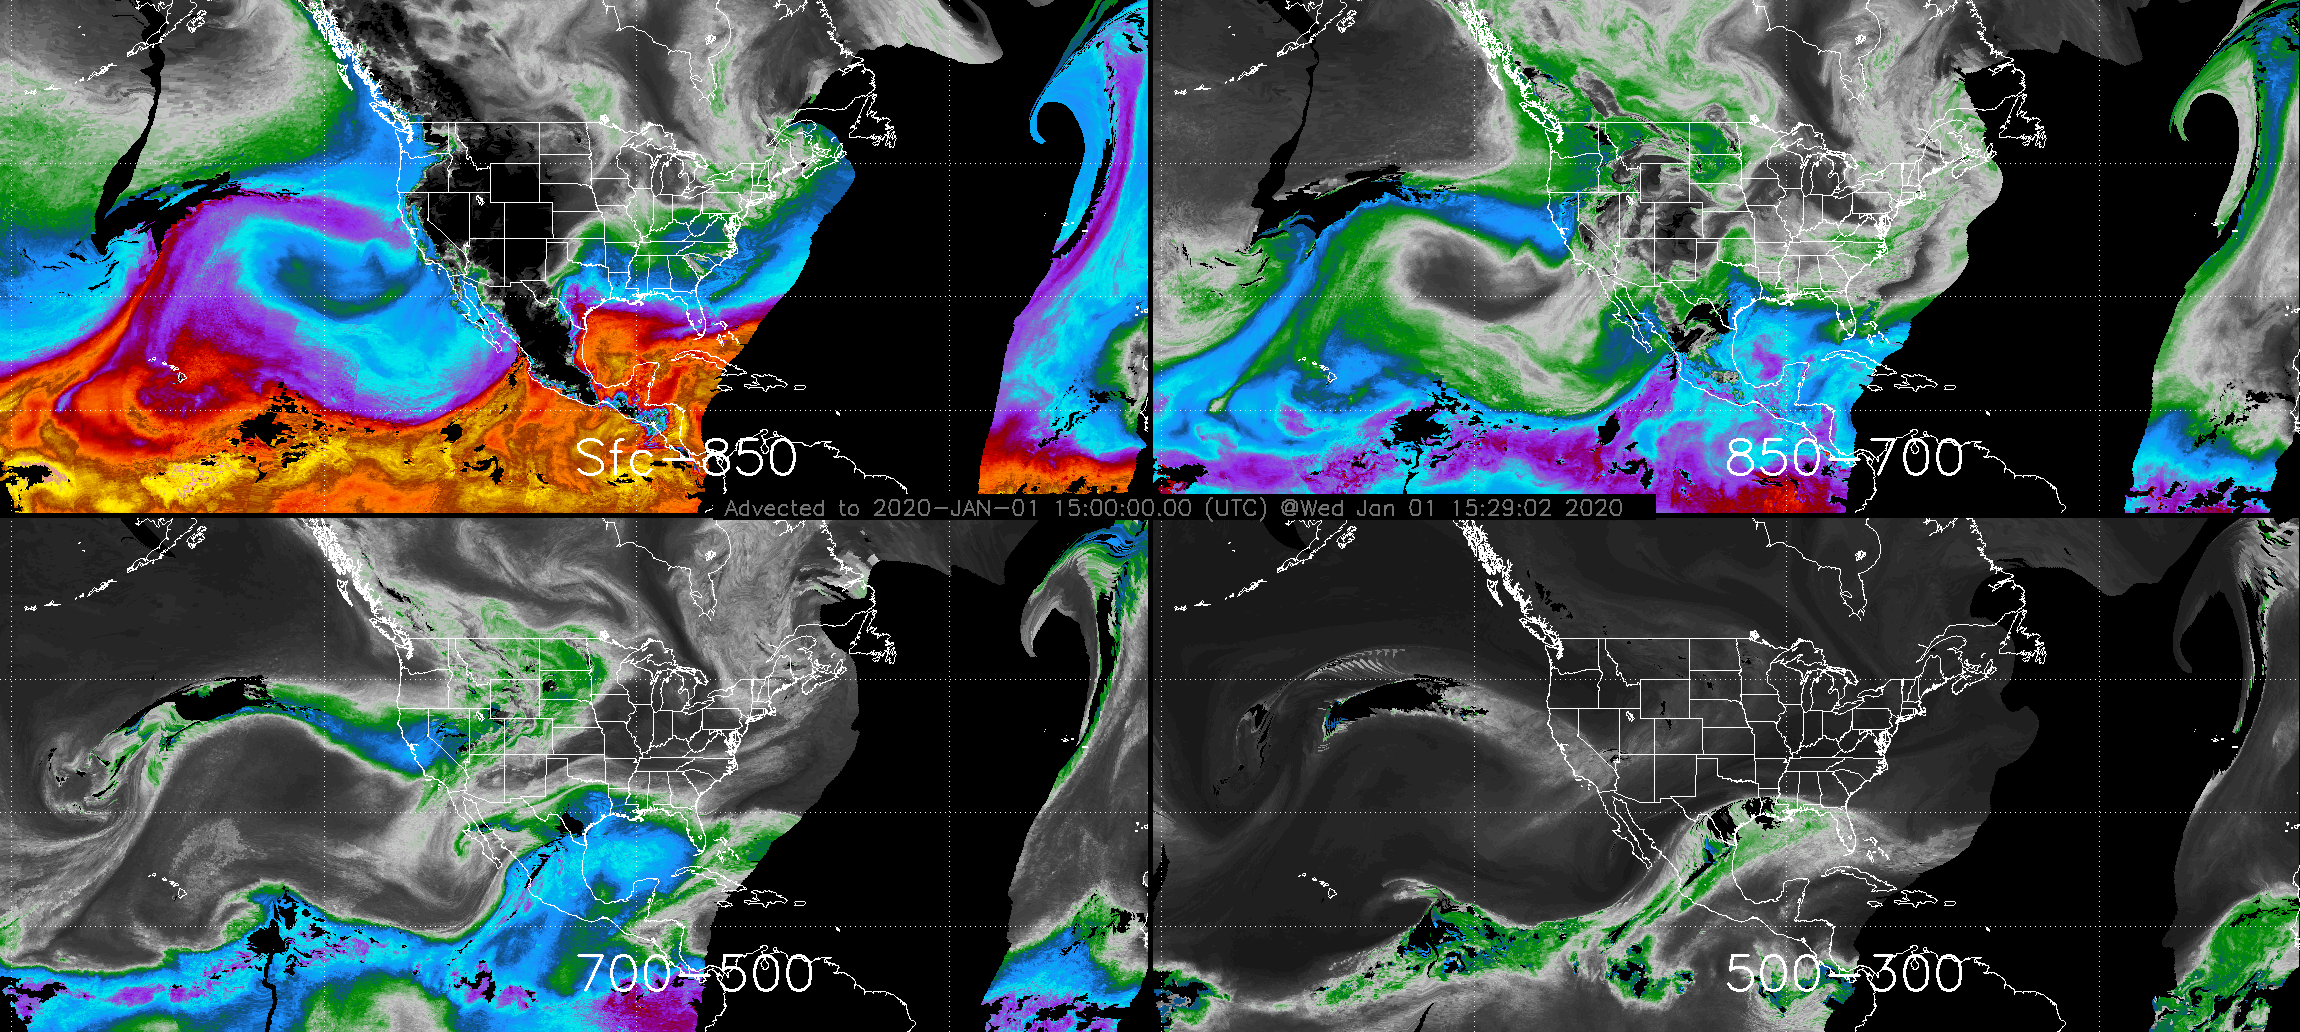
“If you take a simple variable like the cloud coverage fraction, it’s a 3D volume spanning the entire globe,” says Messmer, who has been collaborating with Bauer’s team at the ECMWF to make VR simulations out of ECMWF climate data. “Yet the data that is typically generated for operational uses from this variable is 2D. So forecasters take slices off this volume and project it down onto a 2D surface.
“For many use cases this is perfectly okay. For example, if I’m a pilot I don’t care about the full three-dimensional structure of the windshield. All I care about is what the wind is doing along the trajectory of
my airplane.”
But when forecasters are interested in the full three-dimensional structure of a particular data set, the 2D visualizations become limiting, notes Patrick Meyers, a researcher in the earth science department at the University of Maryland and part of the MeteoVis team.
“With AWIPS, if you want to look at different levels of the atmosphere it’s just a bunch of plots on top of each other and you’re left having to interpret a 2D field,” says Meyers. “But with an immersive VR experience you’re suddenly in the atmosphere. You can see everything around you and the physical relationship between these different features of the atmosphere.”
Getting fully immersed
Of course, three-dimensionality is not a new concept in weather visualization. The software already exists to create 3D visualizations of weather data sets. But even with these 3D visualizations it can still be hard to fully apprehend the 3D structures of the atmosphere because of what Messmer refers to as the “unnatural intermediate steps” the viewer is forced to undertake.
According to Messmer, if a user wants to look in a particular direction they have to tell their brain to move a mouse and then once navigated into position, the user is faced with a 3D structure that appears as a 2D projection on their screen, which their brain then has to transform back into 3D.
With VR these intermediate steps are bypassed and the viewer can move intuitively through the virtual environment, turning their head in the direction they want to look, while being fully immersed in the 3D experience. This immersive experience can be especially useful, according to Messmer, in helping meteorologists identify anomalies in the models that might otherwise be much harder to detect through a finecombing of the data or through traditional 2D or 3D renderings.
He explains, “If you take cloud data, for example. We all have a pretty intuitive understanding of what clouds should look like. So if you’re in the same space as the cloud and able to look all around it, it’s a much easier way to detect when something looks strange.”
High-resolution VR
Creating VR simulations requires highly accurate data sets, notes Bauer. The current data sets used in most weather modeling usually only go down to resolutions of about 10km (6 miles), he notes.
Running these data sets through VR software would produce very approximate reproductions of reality. However, many of the data sets expected to come on line in the next few years through the new generation of weather satellites are much higher resolution. Applying VR to these would yield much better results, according to Bauer.
He says, “If we upgraded from 10km resolution to a 1km [0.6-mile] resolution or higher, you would actually see the valley you live in. You wouldn’t see individual trees or buildings but you would see London, for example. You wouldn’t see individual clouds, but you would see groups of clouds. So we’re on the verge of something where we could feed the VR technology with a lot more realistic data.”
But in order to reach these higher resolutions and to ensure the models remain accurate requires extremely high-performance computing, much higher than exists at present.
Part of the problem, as Nvidia’s Messmer comments, is that, “VR simulations, in order to avoid nausea for the viewer, have to be rendered at very high refresh rates of about 90-120Hz. And doing that on very large data sets is still a technological challenge.”
Even the new computer system currently under construction at the ECMWF’s new data center in Bologna will not be powerful enough for the task, notes Bauer. In order to “stretch their legs”, Bauer’s team have run simulations with the 1km-resolution data on IBM’s Summit, the world’s largest supercomputer housed in Oak Ridge, Tennessee. “It’s like if I’m testing my new Formula 1 car but I don’t have a race course yet,” he says. “So I test it on somebody else’s course just to see how it drives.”
The right use case
Another question surrounding the application of VR to meteorology is how exactly it can be used. Most of those developing VR systems envisage outreach and education as the best applications for the technology, at least in the short term.
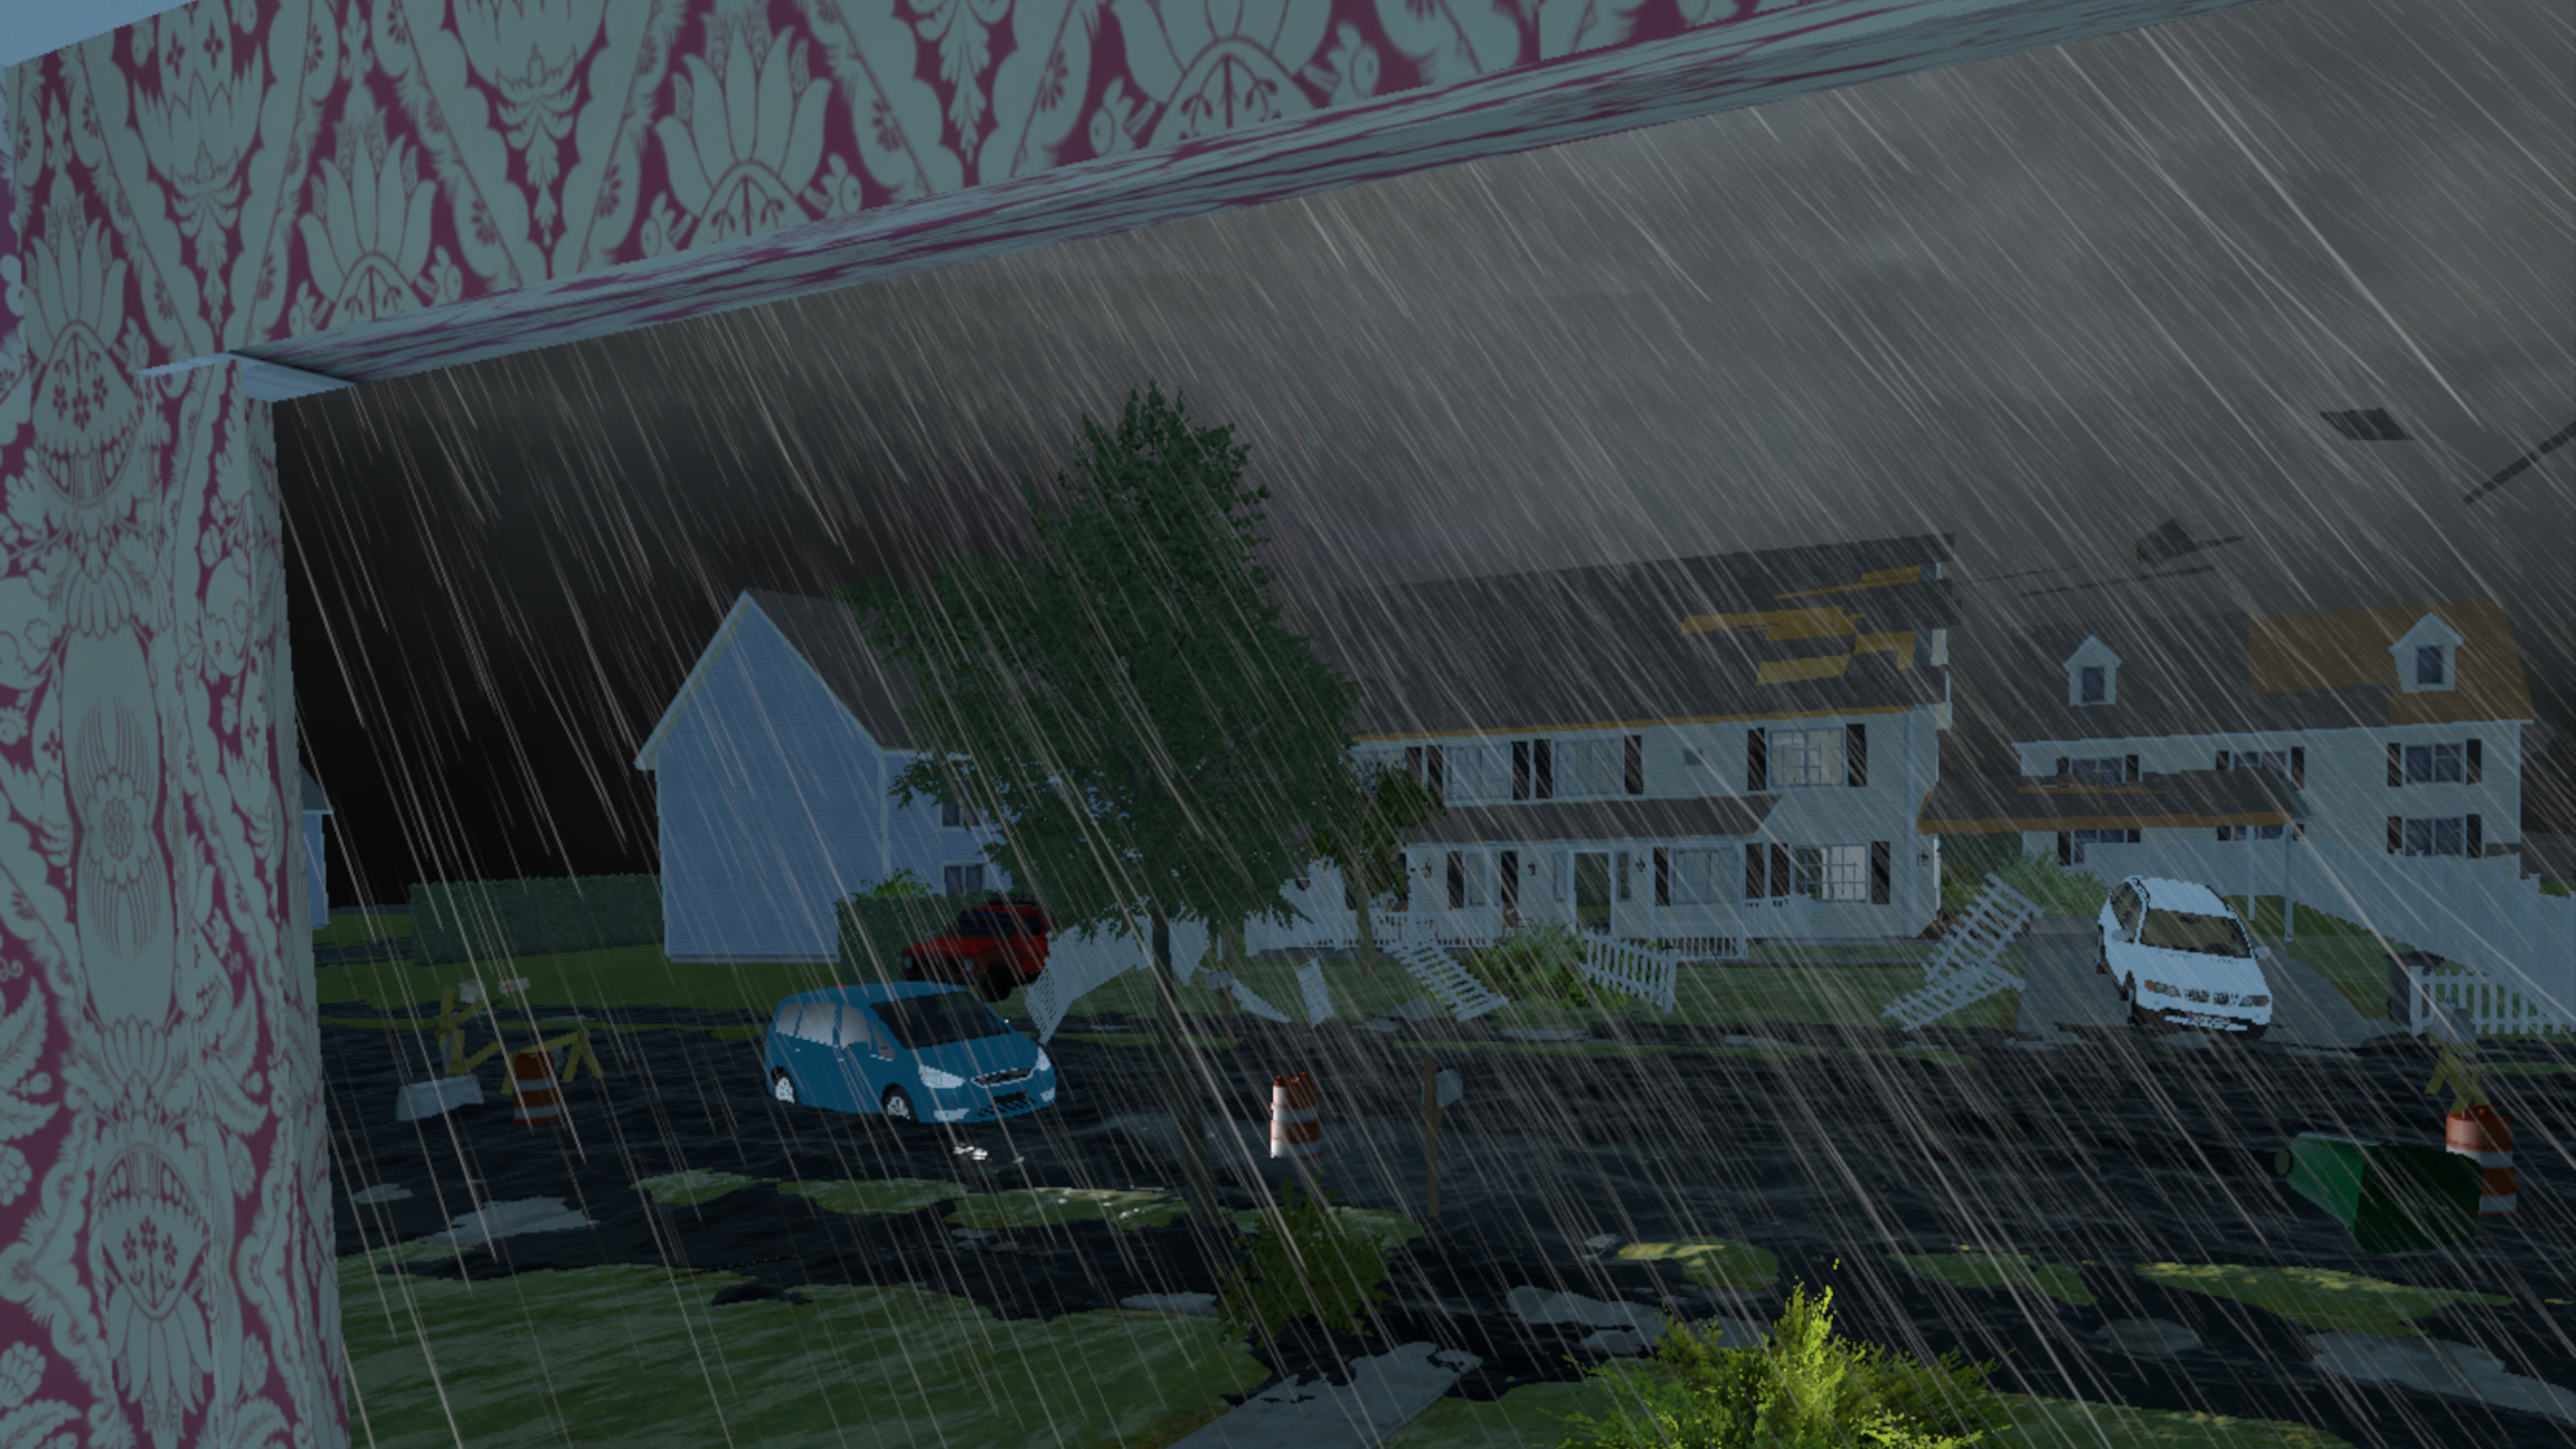
A good example of an outreach project was a VR simulation created by scientists at Hofstra University in Long Island, New York, to communicate hurricane risk. During the 77-second simulation, viewers wearing a VR headset experience a realistic recreation of a hurricane hitting landfall, complete with an audio soundtrack and a 360° view of the environment.
The simulation was conceived to test the value of VR as a way of communicating hurricane risk to the general public. The lead author of the project, Hofstra environmental scientist Jase Bernhardt, has since used the simulation as an educational tool in schools as well as taking it to conferences and events such as the annual gathering of the American Meteorological Society and a tour organized each year by the US
National Hurricane Center.
Bernhardt says, “In terms of educating children in particular, letting them put on the headset and experience the VR makes for a much more memorable experience, and hopefully gives them a lifelong understanding of hurricanes and their impacts.”
In a media age, VR also provides a good way for meteorologists to showcase their work to a wider audience, according to Messmer. “Because ultimately most scientists are publicly funded, they have a responsibility to communicate the way that they’re spending these funds back to the general public,” he says. “So the more accessible they can make it, the better it is from an educational point of view. Not just educational in the classroom sense, but also in the sense of outreach to the general public.”
This point is echoed by Bauer, who says that there would be a “high communication value” in being able to provide the public with realistic renderings of current weather. “I think just in terms of psychology, if you had a VR image that created a very realistic rendering of real-time weather, it could increase public confidence in what we do,” he says.
While the value of VR for end-consumers and education is not to be overlooked, Bauer, Messmer and the team behind MeteoVis ultimately want their VR tools to be integral to the forecasting process itself. But for this to happen it is not only a question of overcoming the technological hurdles, according to Messmer. There are also psychological barriers to the technologies’ uptake.
He concludes, “When we show the VR to experienced meteorologists, they look at this stuff and they say, ‘Why do I need that? I can look at my 2D plots and I know what is happening.’ Because these people have been trained to operate without this tool, it’s harder for them to see the value, but I’m convinced that this is a technology that will greatly impact current and future generation meteorologists.”
This article was originally published in the September 2020 issue of Meteorological Technology International