Close Menu
Meteorological Technology International
  • News
    • A-E
      • Agriculture
      • Automated Weather Stations
      • Aviation
      • Climate Measurement
      • Data
      • Developing Countries
      • Digital Applications
      • Early Warning Systems
      • Extreme Weather
    • G-P
      • Hydrology
      • Lidar
      • Lightning Detection
      • New Appointments
      • Nowcasting
      • Numerical Weather Prediction
      • Polar Weather
    • R-S
      • Radar
      • Rainfall
      • Remote Sensing
      • Renewable Energy
      • Satellites
      • Solar
      • Space Weather
      • Supercomputers
    • T-Z
      • Training
      • Transport
      • Weather Instruments
      • Wind
      • World Meteorological Organization
      • Meteorological Technology World Expo
  • Features
  • Online Magazines
    • January 2026
    • April 2025
    • January 2025
    • September 2024
    • April 2024
    • Archive Issues
    • Subscribe Free!
  • Opinion
  • Videos
  • Supplier Spotlight
  • Expo
LinkedIn X (Twitter) Facebook
  • Sign-up for Free Weekly E-Newsletter
  • Meet the Editors
  • Contact Us
  • Media Pack
LinkedIn Facebook
Subscribe
Meteorological Technology International
  • News
      • Agriculture
      • Automated Weather Stations
      • Aviation
      • Climate Measurement
      • Data
      • Developing Countries
      • Digital Applications
      • Early Warning Systems
      • Extreme Weather
      • Hydrology
      • Lidar
      • Lightning Detection
      • New Appointments
      • Nowcasting
      • Numerical Weather Prediction
      • Polar Weather
      • Radar
      • Rainfall
      • Remote Sensing
      • Renewable Energy
      • Satellites
      • Solar
      • Space Weather
      • Supercomputers
      • Training
      • Transport
      • Weather Instruments
      • Wind
      • World Meteorological Organization
      • Meteorological Technology World Expo
  • Features
  • Online Magazines
    1. April 2026
    2. January 2026
    3. September 2025
    4. April 2025
    5. January 2025
    6. September 2024
    7. April 2024
    8. January 2024
    9. Archive Issues
    10. Subscribe Free!
    Featured
    May 5, 2026

    In this Issue – April 2026

    By Web TeamMay 5, 2026
    Recent

    In this Issue – April 2026

    May 5, 2026

    In this Issue – January 2026

    November 27, 2025

    In this Issue – September 2025

    August 11, 2025
  • Opinion
  • Videos
  • Supplier Spotlight
  • Expo
Facebook LinkedIn
Subscribe
Meteorological Technology International
Hydrology

Intensity ranking for atmospheric rivers ready for global use, claims study

Dan SymondsBy Dan SymondsMarch 10, 20234 Mins Read
Share LinkedIn Facebook Twitter Email
Credit - Pixabay
Share
LinkedIn Facebook Twitter Email

US scientists have used a recently developed scale for atmospheric river intensity (akin to the hurricane scale) to rank atmospheric rivers and identify hotspots not only along the US West Coast but around the world.

Atmospheric rivers typically form when warm temperatures create moist packets of air, which strong winds then transport across the ocean, with some making landfall. The intensity scale ranks these atmospheric rivers from AR-1 to AR-5 (with AR-5 being the most intense) based on how long they last and how much moisture they transport.

F Martin Ralph, an atmospheric scientist at Scripps Institution of Oceanography and study co-author, said, “Atmospheric rivers are the hurricanes of the West Coast when it comes to the public’s situational awareness. People need to know when they’re coming, have a sense for how extreme the storm will be, and know how to prepare. This scale is designed to help answer all those questions.”

Credit: AGU

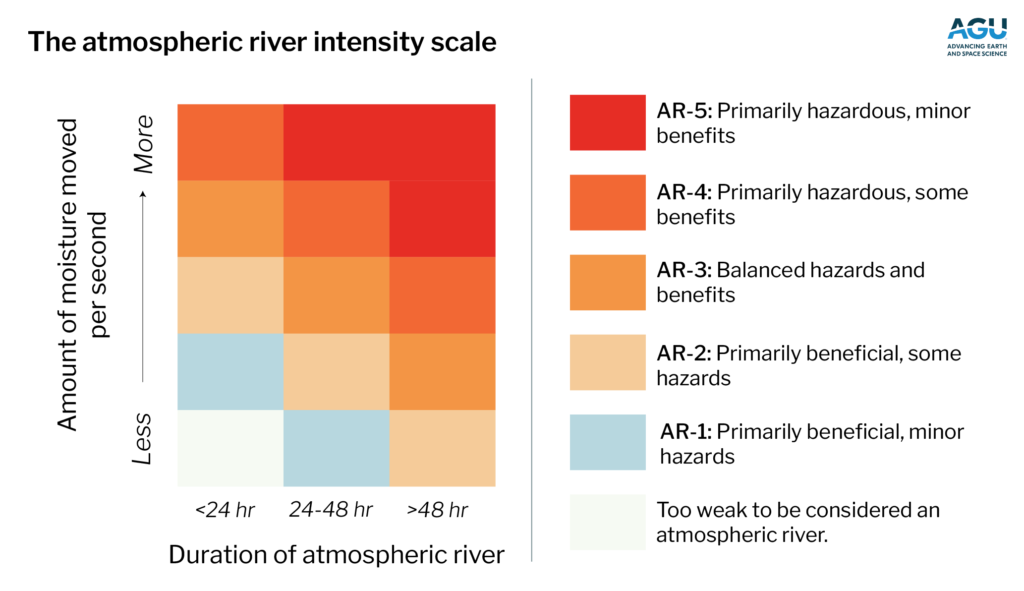
Ralph and his colleagues originally developed the scale for the US West Coast. The new study demonstrates that atmospheric river events can be directly compared globally using the intensity scale, which is how the researchers identified where the most intense events (AR-5) form and fizzle out, and how many of those make landfall.

The researchers used climate data and their previously developed algorithm for identifying and tracking atmospheric rivers to build a database of intensity-ranked atmospheric river events around the globe over 40 years (1979/1980 to 2019/2020). The study was published in the Journal of Geophysical Research: Atmospheres, which publishes research that advances understanding of Earth’s atmosphere and its interaction with other components of the Earth system.

Bin Guan, an atmospheric scientist at the Joint Institute for Regional Earth System Science and Engineering, a collaboration between University of California-Los Angeles and NASA’s Jet Propulsion Laboratory, who led the study, said, “This study is a first step toward making the atmospheric river scale a globally useful tool for meteorologists and city planners. By mapping out the footprints of each atmospheric river rank globally, we can start to better understand the societal impacts of these events in many different regions.”

The authors also found that more intense atmospheric rivers (AR-4 and AR-5) are less common than weaker events, with AR-5 events occurring only once every two to three years when globally averaged. The most intense atmospheric rivers are also less likely to make landfall, and when they do, they are unlikely to maintain their strength for long and penetrate farther inland. “They tend to dissipate soon after landfall, leaving their impacts most felt in coastal areas,” said Guan.

The study found four “centers,” or hotspots, of where AR-5s tend to die, in the extratropical North Pacific and Atlantic, Southeast Pacific and Southeast Atlantic. Cities on the coasts within these hotspots, such as San Francisco and Lisbon, are most likely to see intense AR-5s make landfall. Midlatitudes in general are the most likely regions to have atmospheric rivers of any rank.

Strong El Niño years are more likely to have more atmospheric rivers, and stronger ones at that, which is noteworthy because NOAA recently forecast that an El Niño condition is likely to develop by the end of the summer this year.

While local meteorologists, news outlets and other West Coasters may have incorporated “atmospheric river” and the intensity scale into their lives, adoption has been slower elsewhere, Ralph said. He hopes to see, within five years or so, meteorologists on TV around the world incorporating the atmospheric river intensity scale into their forecasts, telling people whether the atmospheric river will be beneficial or if they need to prepare for a serious storm.

To view the complete study published in the Journal of Geophysical Research: Atmospheres, click here.

Previous ArticleBaron to install X- and C-band weather radars throughout Morocco
Next Article Australian wildfires widened ozone hole by 10% in 2020

Read Similar Stories

Climate Measurement

Cloud measurement campaign targets improved climate model accuracy

May 20, 20263 Mins Read
Videos

VIDEO: Meteosat-12 imagery over Europe and Africa made available via YouTube streams

May 19, 20262 Mins Read
Extreme Weather

Impacts of extreme weather and rising temperatures intensify across Latin America and Caribbean

May 15, 20263 Mins Read
Latest News

R.M. Young Company reengineers SNOdar snow-depth sensor

May 21, 2026

SMILE mission launches to study Earth’s magnetic shield and space weather

May 20, 2026

Cloud measurement campaign targets improved climate model accuracy

May 20, 2026

Receive breaking stories and features in your inbox each week, for free


Enter your email address:


Supplier Spotlights
  • MicroStep-MIS
Getting in Touch
  • Contact Us / Advertise
  • Meet the Editors
  • Media Pack
  • Free Weekly E-Newsletter
Our Social Channels
  • Facebook
  • LinkedIn
© 2026 UKi Media & Events a division of UKIP Media & Events Ltd
  • Cookie Policy
  • Privacy Policy
  • Terms and Conditions
  • Notice and Takedown Policy

Type above and press Enter to search. Press Esc to cancel.