Close Menu
Meteorological Technology International
  • News
    • A-E
      • Agriculture
      • Automated Weather Stations
      • Aviation
      • Climate Measurement
      • Data
      • Developing Countries
      • Digital Applications
      • Early Warning Systems
      • Extreme Weather
    • G-P
      • Hydrology
      • Lidar
      • Lightning Detection
      • New Appointments
      • Nowcasting
      • Numerical Weather Prediction
      • Polar Weather
    • R-S
      • Radar
      • Rainfall
      • Remote Sensing
      • Renewable Energy
      • Satellites
      • Solar
      • Space Weather
      • Supercomputers
    • T-Z
      • Training
      • Transport
      • Weather Instruments
      • Wind
      • World Meteorological Organization
      • Meteorological Technology World Expo
  • Features
  • Online Magazines
    • January 2026
    • April 2025
    • January 2025
    • September 2024
    • April 2024
    • Archive Issues
    • Subscribe Free!
  • Opinion
  • Videos
  • Supplier Spotlight
  • Expo
LinkedIn X (Twitter) Facebook
  • Sign-up for Free Weekly E-Newsletter
  • Meet the Editors
  • Contact Us
  • Media Pack
LinkedIn Facebook
Subscribe
Meteorological Technology International
  • News
      • Agriculture
      • Automated Weather Stations
      • Aviation
      • Climate Measurement
      • Data
      • Developing Countries
      • Digital Applications
      • Early Warning Systems
      • Extreme Weather
      • Hydrology
      • Lidar
      • Lightning Detection
      • New Appointments
      • Nowcasting
      • Numerical Weather Prediction
      • Polar Weather
      • Radar
      • Rainfall
      • Remote Sensing
      • Renewable Energy
      • Satellites
      • Solar
      • Space Weather
      • Supercomputers
      • Training
      • Transport
      • Weather Instruments
      • Wind
      • World Meteorological Organization
      • Meteorological Technology World Expo
  • Features
  • Online Magazines
    1. January 2026
    2. September 2025
    3. April 2025
    4. January 2025
    5. September 2024
    6. April 2024
    7. January 2024
    8. September 2023
    9. April 2023
    10. Archive Issues
    11. Subscribe Free!
    Featured
    November 27, 2025

    In this Issue – January 2026

    By Hazel KingNovember 27, 2025
    Recent

    In this Issue – January 2026

    November 27, 2025

    In this Issue – September 2025

    August 11, 2025

    In this Issue – April 2025

    April 15, 2025
  • Opinion
  • Videos
  • Supplier Spotlight
  • Expo
Facebook LinkedIn
Subscribe
Meteorological Technology International
Climate Measurement

US wildfires above average intensity

Lawrence ButcherBy Lawrence ButcherSeptember 18, 20202 Mins Read
Share LinkedIn Facebook Twitter Email
Share
LinkedIn Facebook Twitter Email

Data from the Copernicus Atmosphere Monitoring Service (CAMS), implemented by the European Centre for Medium-Range Weather Forecasts on behalf of the European Commission, reveals that the wildfires currently raging across the Western USA are significantly more intense than the 2003-2019 average for the whole country and the affected states.

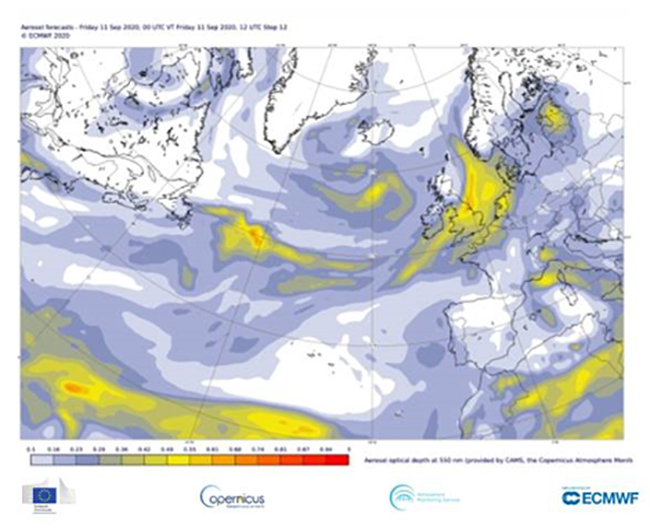
CAMS, which monitors daily wildfire activity worldwide using satellite observations of their intensity to estimate emissions of atmospheric pollutants, says it has tracked the long-range transport of the smoke as far as 8,000km away in Northern Europe.

The fires burning in California since mid-August, and in Oregon and Washington since the beginning of September, have emitted vast quantities of thick smoke that has affected a huge area. The fires emitted an estimated 21.7 megatons of carbon in California, 7.3 megatons of carbon in Oregon and 1.4 megatons of carbon in Washington. Overall emissions for Western USA were up to an estimated 30.3 megatons of carbon.

Mark Parrington, CAMS senior scientist and wildfire expert, explained the significance of the current fires, “The scale and magnitude of these fires are at a level much higher than in any of the 18 years that our monitoring data covers, since 2003. A good indicator of smoke thickness is the aerosol optical depth, or AOD.

“In the Western USA, we have seen that AOD levels have reached very high values of seven or above, which has been confirmed by independent ground-based measurement. To put this into perspective, an AOD of one would already indicate a lot of aerosols in the atmosphere. CAMS monitoring of atmospheric conditions is vital in situations like that as, it provides decision-makers and other individuals with the knowledge to make informed choices regarding their heath and the health of others.”

Previous ArticleBusy hurricane season exhausts name list
Next Article From hurricanes to the red planet: radiosonde technology is on a mission to Mars

Read Similar Stories

Agriculture

Extreme heat posing significant risks to ecosystems and agriculture, FAO-WMO report warns

April 22, 20263 Mins Read
Data

Atmospheric G2 secures Japan weather forecasting license

April 21, 20262 Mins Read
Climate Measurement

China completes Antarctic meteorological research mission with Xuelong icebreaker

April 21, 20262 Mins Read
Latest News

Extreme heat posing significant risks to ecosystems and agriculture, FAO-WMO report warns

April 22, 2026

Atmospheric G2 secures Japan weather forecasting license

April 21, 2026

China completes Antarctic meteorological research mission with Xuelong icebreaker

April 21, 2026

Receive breaking stories and features in your inbox each week, for free


Enter your email address:


Supplier Spotlights
  • EUMETSAT
Getting in Touch
  • Contact Us / Advertise
  • Meet the Editors
  • Media Pack
  • Free Weekly E-Newsletter
Our Social Channels
  • Facebook
  • LinkedIn
© 2026 UKi Media & Events a division of UKIP Media & Events Ltd
  • Cookie Policy
  • Privacy Policy
  • Terms and Conditions
  • Notice and Takedown Policy

Type above and press Enter to search. Press Esc to cancel.