Meteorological Technology International
  • News
    • A-E
      • Agriculture
      • Automated Weather Stations
      • Aviation
      • Climate Measurement
      • Data
      • Developing Countries
      • Digital Applications
      • Early Warning Systems
      • Extreme Weather
    • G-P
      • Hydrology
      • Lidar
      • Lightning Detection
      • New Appointments
      • Nowcasting
      • Numerical Weather Prediction
      • Polar Weather
    • R-S
      • Radar
      • Rainfall
      • Remote Sensing
      • Renewable Energy
      • Satellites
      • Solar
      • Space Weather
      • Supercomputers
    • T-Z
      • Training
      • Transport
      • Weather Instruments
      • Wind
      • World Meteorological Organization
      • Meteorological Technology World Expo
  • Features
  • Online Magazines
    • April 2025
    • January 2025
    • September 2024
    • April 2024
    • Archive Issues
    • Subscribe Free!
  • Opinion
  • Videos
  • Supplier Spotlight
  • Expo
LinkedIn Twitter Facebook
  • Sign-up for Free Weekly E-Newsletter
  • Meet the Editors
  • Contact Us
  • Media Pack
LinkedIn Facebook
Subscribe
Meteorological Technology International
  • News
      • Agriculture
      • Automated Weather Stations
      • Aviation
      • Climate Measurement
      • Data
      • Developing Countries
      • Digital Applications
      • Early Warning Systems
      • Extreme Weather
      • Hydrology
      • Lidar
      • Lightning Detection
      • New Appointments
      • Nowcasting
      • Numerical Weather Prediction
      • Polar Weather
      • Radar
      • Rainfall
      • Remote Sensing
      • Renewable Energy
      • Satellites
      • Solar
      • Space Weather
      • Supercomputers
      • Training
      • Transport
      • Weather Instruments
      • Wind
      • World Meteorological Organization
      • Meteorological Technology World Expo
  • Features
  • Online Magazines
    1. April 2025
    2. January 2025
    3. September 2024
    4. April 2024
    5. January 2024
    6. September 2023
    7. April 2023
    8. Archive Issues
    9. Subscribe Free!
    Featured
    April 15, 2025

    In this Issue – April 2025

    By Web TeamApril 15, 2025
    Recent

    In this Issue – April 2025

    April 15, 2025

    In this Issue – January 2025

    December 13, 2024

    In this Issue – September 2024

    August 8, 2024
  • Opinion
  • Videos
  • Supplier Spotlight
  • Expo
Facebook LinkedIn
Subscribe
Meteorological Technology International
Features

INTERVIEW: Beth Tellman, assistant professor at the University of Arizona School of Geography, Development and Environment

Niranjana Rajalakshmi, science writer at University of Arizona CommunicationsBy Niranjana Rajalakshmi, science writer at University of Arizona CommunicationsJuly 5, 20246 Mins Read
Share LinkedIn Facebook Twitter Email
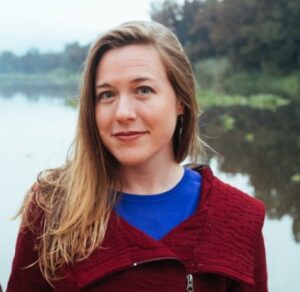
Beth Tellman, an assistant professor in the University of Arizona School of Geography, Development, and Environment in the College of Social and Behavioral Sciences, spoke to University of Arizona News about her use of machine learning (ML) models to develop datasets for flood monitoring.
Share
LinkedIn Facebook Twitter Email

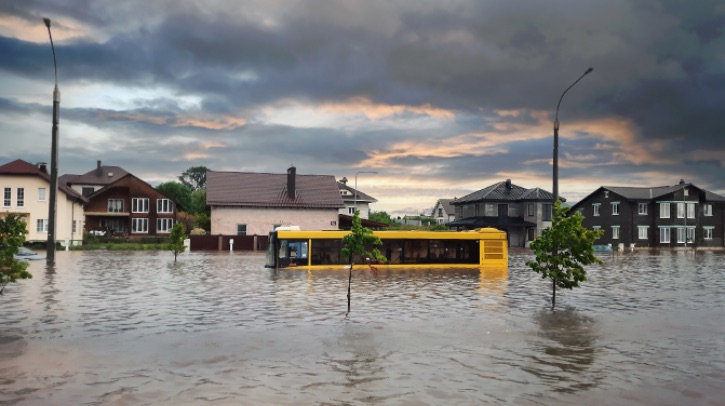
Beth Tellman, an assistant professor in the University of Arizona School of Geography, Development and Environment in the College of Social and Behavioral Sciences, spoke to University of Arizona News about her use of machine learning (ML) models to develop datasets for flood monitoring. Tellman’s work aims to improve the assessment of populations vulnerable to flood exposure and support the understanding of interactions between land cover, climate change and floods. She also details how satellite monitoring helps translate people’s flood experiences into maps for policymakers.

What are your current projects related to flooding?

One important focus of our projects is improving algorithms to detect water and floods from satellite images. Some of that work is NASA-funded and has applied aspects within NASA itself. For example, one of the most used satellite sensors in flood monitoring is the Visible Infrared Imaging Radiometer Suite (VIIRS), which is a NASA-funded project. VIIRS captures one to two images per day everywhere on Earth. This makes it useful for monitoring floods on a global scale.

We are also working with applied data and algorithms in real-world situations. Currently, we are partnering with community-based organizations in the Rio Grande Valley, Texas, to build a satellite-based flood database. The database is not just based on our algorithms in the lab and the satellite data. Rather, we are retraining our algorithms with data and experiences from our partners and the people. We also have a major applied project partnering with the Government of Bangladesh for flood monitoring with satellites.

My newest project is about trying to create a US flood database to understand how urban development influences new flood patterns. I was awarded a National Science Foundation Faculty Early Career Development Program (CAREER) Award for this project, which involves tracking urban development. If someone builds flood control infrastructure, they often will register that with the Federal Emergency Management Agency (FEMA) to remove their property from the regulatory flood plain to either increase the property value or reduce insurance costs. We are building a spatial history of where urban development has changed the FEMA regulatory flood plain in the US to see if that’s really decreasing flooding or if that’s just moving floodwaters downstream to other communities. So, we’re using satellite imagery with government records of urban development in flood plains to try and see if there is any flood inequality in the US.
How do you map floods?

There are pretty good government records in the US on where floods have happened. The National Centers for Environmental Information (NCEI) has a great storm events database, for instance. There are thousands of flood events that are recorded. Typically, county governments send those details in, so, we generally know where a flood has happened on a county scale. We can then pull all satellite imagery for that county and map all the floods that we see in those images. On a global scale, we use a flood inventory that we’ve been using for a long time called the Colorado Flood Observatory. They basically have an Excel spreadsheet of major global floods that appeared in the media. They’ve been keeping this up since the 1980s. Media can also be inventories of some kind – it gives you a sense of where a flood might have happened. We use media to pull the imagery and make high-resolution pictures of that flood event.

Sometimes, we can use people’s flood experiences and their own social media records to get data that may have otherwise not appeared in a government database. For example, in the Rio Grande Valley, when we asked people about the details of flooding, people shared their Facebook messages and texts they sent to other people.

What are the implications of these flood maps for the public and policymakers?

Our satellite images have helped translate people’s flood experiences into a map of their entire area that they can then give to a policymaker or government official. We haven’t mapped all tens of thousands of flood events in the US yet. It’s something I hope to do. In my NSF CAREER project, we mapped approximately 100 events in the US, but I’m working on building a very comprehensive map that would help understand flood history. These maps would be useful for big insurance companies and government agencies that look at large, impactful events.

What are some challenges in flood predictions?

Our research doesn’t entail any flood prediction, only observation. Flood prediction is tricky because there are many different types of floods, and the science behind each type is different. For example, in riverine flooding, water overflows the riverbank. So, scientists will look at melting snowpack rates and seasonal predictions of rainfall to see if there’s going to be a large flood. Coastal flooding from storm surges or from hurricanes is dealt with differently – tropical cyclone prediction is considered, and storm surge models are built.

The other type of flooding – which is the hardest to predict – is pluvial flooding. This is the one that impacts most cities in the US. Here, flooding results from direct rainfall pounding on a surface. We are very bad at predicting those because pluvial flooding often comes from convective storms. These are large downpours from thunderstorms – a weather phenomenon notoriously hard to predict.

There have been several floods in the USA over the past few months of this year. Could you offer some perspective on that?

We’ve experienced some major flooding this spring. There was massive flooding from a large rainfall storm system in Houston. Additionally, there’s a prediction for a record number of hurricanes this summer, which would probably bring in storm surges and flooding. We know from the summer of 2023 that a warmer climate and a hotter summer means more ability for the atmosphere to hold water. We also know that stronger storms can occur because of these warming patterns. With warm ocean temperatures, we saw huge storms and pluvial flooding in the US in 2023. I don’t do flood predictions, but from what we know about what happened last year, I think we’re probably in for big summer flooding in urban cities across the US again.

In related news, the Cooperative Institute for Research In Environmental Sciences (CIRES) at the University of Colorado Boulder recently released a study that reveals that an increase in precipitation alone won’t necessarily increase disastrous flooding – instead, flood risk depends on how many days have passed between storms. Click here to read the full story.

Previous ArticleEUMETSAT awards Meteosat Third Generation-Sounder 1 satellite launch contract to SpaceX
Next Article Scripps Oceanography researchers measure deep water upwelling with 55 gallons of fluorescent dye

Read Similar Stories

Features

EXCLUSIVE INTERVIEW: Ramla Qureshi, McMaster University’s Department of Civil Engineering

May 14, 20257 Mins Read
Features

FEATURE: How are NOAA’s latest buoys tackling ocean acidification?

March 18, 20256 Mins Read
Features

INTERVIEW: Météo-France

March 14, 20255 Mins Read
Latest News

Integrated model improves flood risk assessment in China

May 15, 2025

EXCLUSIVE INTERVIEW: Ramla Qureshi, McMaster University’s Department of Civil Engineering

May 14, 2025

Tianjin University AI model turns street cameras into rainfall sensors

May 14, 2025

Receive breaking stories and features in your inbox each week, for free


Enter your email address:


Supplier Spotlights
  • GAMIC GmbH
Latest Job Postings
  • Researcher/Engineer to support data-based weather forecasting (R2/RE2)

    • Barcelona
    • Barcelona Supercomputing Center - Centro Nacional de Supercomputación
    • Full Time
Getting in Touch
  • Contact Us / Advertise
  • Meet the Editors
  • Download Media Pack
  • Free Weekly E-Newsletter
Our Social Channels
  • Facebook
  • LinkedIn
© 2025 UKi Media & Events a division of UKIP Media & Events Ltd
  • Cookie Policy
  • Privacy Policy
  • Terms and Conditions
  • Notice and Takedown Policy

Type above and press Enter to search. Press Esc to cancel.

We use cookies on our website to give you the most relevant experience by remembering your preferences and repeat visits. By clicking “Accept”, you consent to the use of ALL the cookies.
Cookie settingsACCEPT
Manage consent

Privacy Overview

This website uses cookies to improve your experience while you navigate through the website. Out of these, the cookies that are categorized as necessary are stored on your browser as they are essential for the working of basic functionalities of the ...
Necessary
Always Enabled

Necessary cookies are absolutely essential for the website to function properly. These cookies ensure basic functionalities and security features of the website, anonymously.

CookieDurationDescription
cookielawinfo-checbox-analytics11 monthsThis cookie is set by GDPR Cookie Consent plugin. The cookie is used to store the user consent for the cookies in the category "Analytics".
cookielawinfo-checbox-functional11 monthsThe cookie is set by GDPR cookie consent to record the user consent for the cookies in the category "Functional".
cookielawinfo-checbox-others11 monthsThis cookie is set by GDPR Cookie Consent plugin. The cookie is used to store the user consent for the cookies in the category "Other.
cookielawinfo-checkbox-necessary11 monthsThis cookie is set by GDPR Cookie Consent plugin. The cookies is used to store the user consent for the cookies in the category "Necessary".
cookielawinfo-checkbox-performance11 monthsThis cookie is set by GDPR Cookie Consent plugin. The cookie is used to store the user consent for the cookies in the category "Performance".
viewed_cookie_policy11 monthsThe cookie is set by the GDPR Cookie Consent plugin and is used to store whether or not user has consented to the use of cookies. It does not store any personal data.

Functional

Functional cookies help to perform certain functionalities like sharing the content of the website on social media platforms, collect feedbacks, and other third-party features.

Performance

Performance cookies are used to understand and analyze the key performance indexes of the website which helps in delivering a better user experience for the visitors.

Analytics

Analytical cookies are used to understand how visitors interact with the website. These cookies help provide information on metrics the number of visitors, bounce rate, traffic source, etc.

Advertisement

Advertisement cookies are used to provide visitors with relevant ads and marketing campaigns. These cookies track visitors across websites and collect information to provide customized ads.

Others

Other uncategorized cookies are those that are being analyzed and have not been classified into a category as yet.

SAVE & ACCEPT
Powered by