Meteorological Technology International
  • News
    • A-E
      • Agriculture
      • Automated Weather Stations
      • Aviation
      • Climate Measurement
      • Data
      • Developing Countries
      • Digital Applications
      • Early Warning Systems
      • Extreme Weather
    • G-P
      • Hydrology
      • Lidar
      • Lightning Detection
      • New Appointments
      • Nowcasting
      • Numerical Weather Prediction
      • Polar Weather
    • R-S
      • Radar
      • Rainfall
      • Remote Sensing
      • Renewable Energy
      • Satellites
      • Solar
      • Space Weather
      • Supercomputers
    • T-Z
      • Training
      • Transport
      • Weather Instruments
      • Wind
      • World Meteorological Organization
      • Meteorological Technology World Expo
  • Features
  • Online Magazines
    • April 2025
    • January 2025
    • September 2024
    • April 2024
    • Archive Issues
    • Subscribe Free!
  • Opinion
  • Videos
  • Supplier Spotlight
  • Expo
LinkedIn Twitter Facebook
  • Sign-up for Free Weekly E-Newsletter
  • Meet the Editors
  • Contact Us
  • Media Pack
LinkedIn Facebook
Subscribe
Meteorological Technology International
  • News
      • Agriculture
      • Automated Weather Stations
      • Aviation
      • Climate Measurement
      • Data
      • Developing Countries
      • Digital Applications
      • Early Warning Systems
      • Extreme Weather
      • Hydrology
      • Lidar
      • Lightning Detection
      • New Appointments
      • Nowcasting
      • Numerical Weather Prediction
      • Polar Weather
      • Radar
      • Rainfall
      • Remote Sensing
      • Renewable Energy
      • Satellites
      • Solar
      • Space Weather
      • Supercomputers
      • Training
      • Transport
      • Weather Instruments
      • Wind
      • World Meteorological Organization
      • Meteorological Technology World Expo
  • Features
  • Online Magazines
    1. April 2025
    2. January 2025
    3. September 2024
    4. April 2024
    5. January 2024
    6. September 2023
    7. April 2023
    8. Archive Issues
    9. Subscribe Free!
    Featured
    April 15, 2025

    In this Issue – April 2025

    By Web TeamApril 15, 2025
    Recent

    In this Issue – April 2025

    April 15, 2025

    In this Issue – January 2025

    December 13, 2024

    In this Issue – September 2024

    August 8, 2024
  • Opinion
  • Videos
  • Supplier Spotlight
  • Expo
Facebook LinkedIn
Subscribe
Meteorological Technology International
Data

Vaisala report reveals the most lightning-prone US metropolitan areas and at-risk wind farms

Elizabeth BakerBy Elizabeth BakerJanuary 8, 20244 Mins Read
Share LinkedIn Facebook Twitter Email
Share
LinkedIn Facebook Twitter Email

Vaisala has published its 2023 Annual Lightning Report, which reveals the 20 most at-risk metropolitan areas in the continental USA.

The Vaisala Xweather Annual Lightning Report ranks all 50 states plus Washington DC by total lightning count and lightning density. Now in its seventh year, the Vaisala Xweather annual lightning report reveals a total of 242,101,157 in-cloud and cloud-to-ground lightning events in the continental USA in 2023 and 2,102,170,206 lightning events worldwide.

“2023 set a record for the number of billion-dollar weather disasters in the United States,” said Samuli Hänninen, head of Vaisala Xweather. “By year-end, 19 of the 25 events with losses exceeding US$1bn were attributed to severe storms. Severe weather can also be life-threatening, especially without the right safety measures in place.

“Lightning triggers wildfires, disrupts power, impacts businesses and poses a significant hazard to life and property. Our 2023 annual lightning report focuses on the risks to windfarms and metropolitan areas. Early warning systems with severe weather forecasting and real-time lightning alerts play an important role in protecting people, businesses and infrastructure from thunderstorms.”

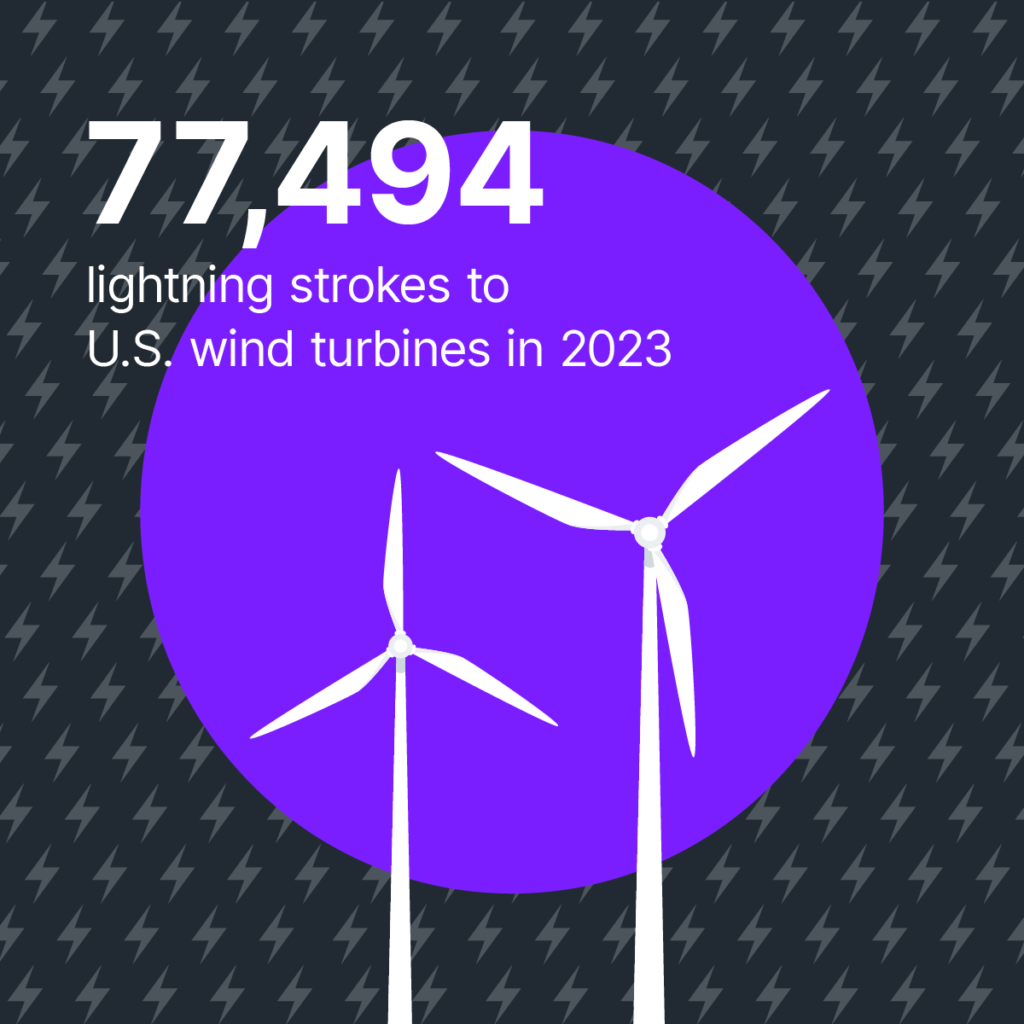
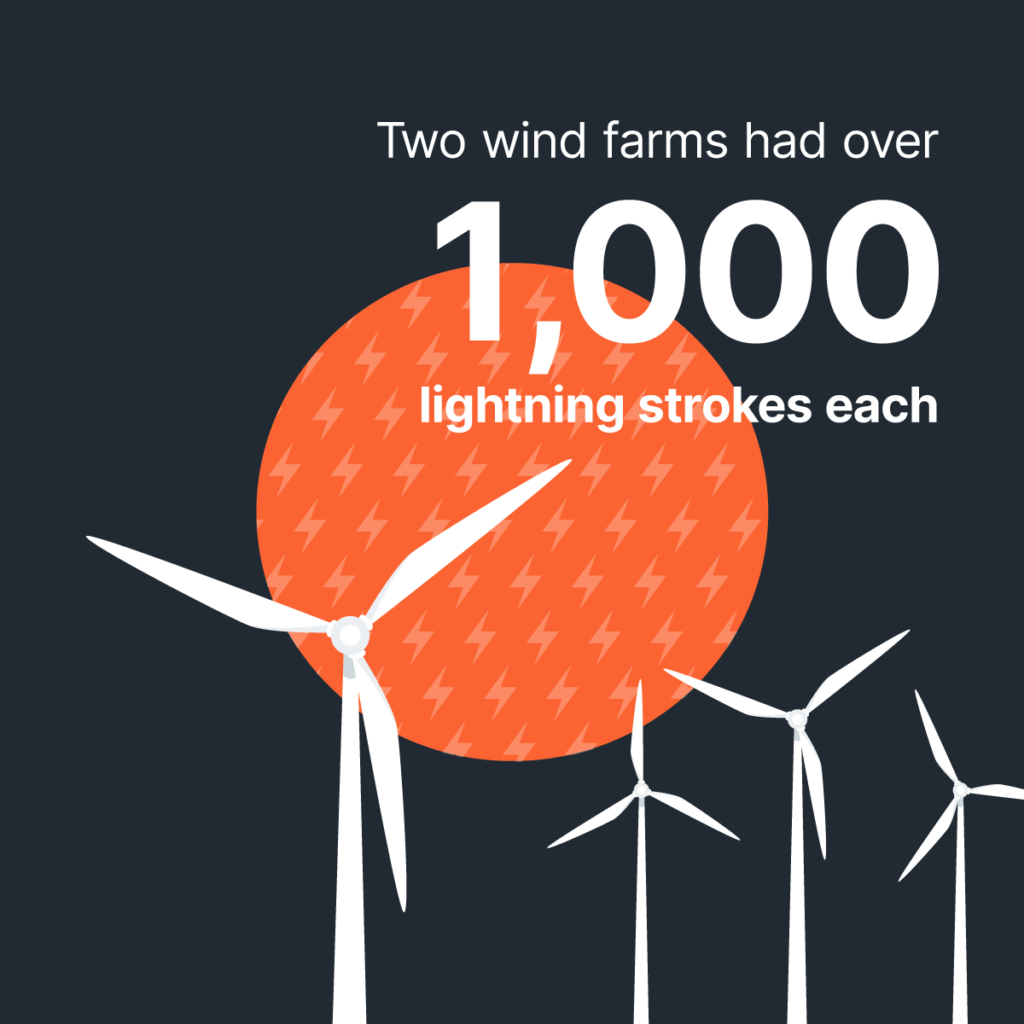
The 2023 Annual Lightning Report highlighted a total of 77,494 lightning strokes at or near 1,500 windfarms in the USA in 2023. A wind farm in Hansford County, Texas and another straddling Blaine and Custer Counties, Oklahoma, saw more than 1,000 strokes each.

In Oklahoma, a wind farm in Pushmataha Country saw an average of 14.4 lightning strokes per turbine in 2023, followed by a wind farm in Freeborn County, Minnesota, with 12 lightning strokes per turbine. In total, three wind farms received more than 10 cloud-to-ground lightning strokes per turbine on average. On the flipside, one-third of US wind farms saw no lightning strikes at all in 2023.

The researchers estimate that lightning damage costs the industry more than US$100m annually and accounts for 60% of blade losses and almost 20% of operational losses overall. When counting lightning strokes per square kilometer, five metropolitan areas in Florida ranked highest for lightning risk in 2023: Miami-Fort Lauderdale, Palm Bay–Melbourne, Cape Coral, Orlando, and Jacksonville.

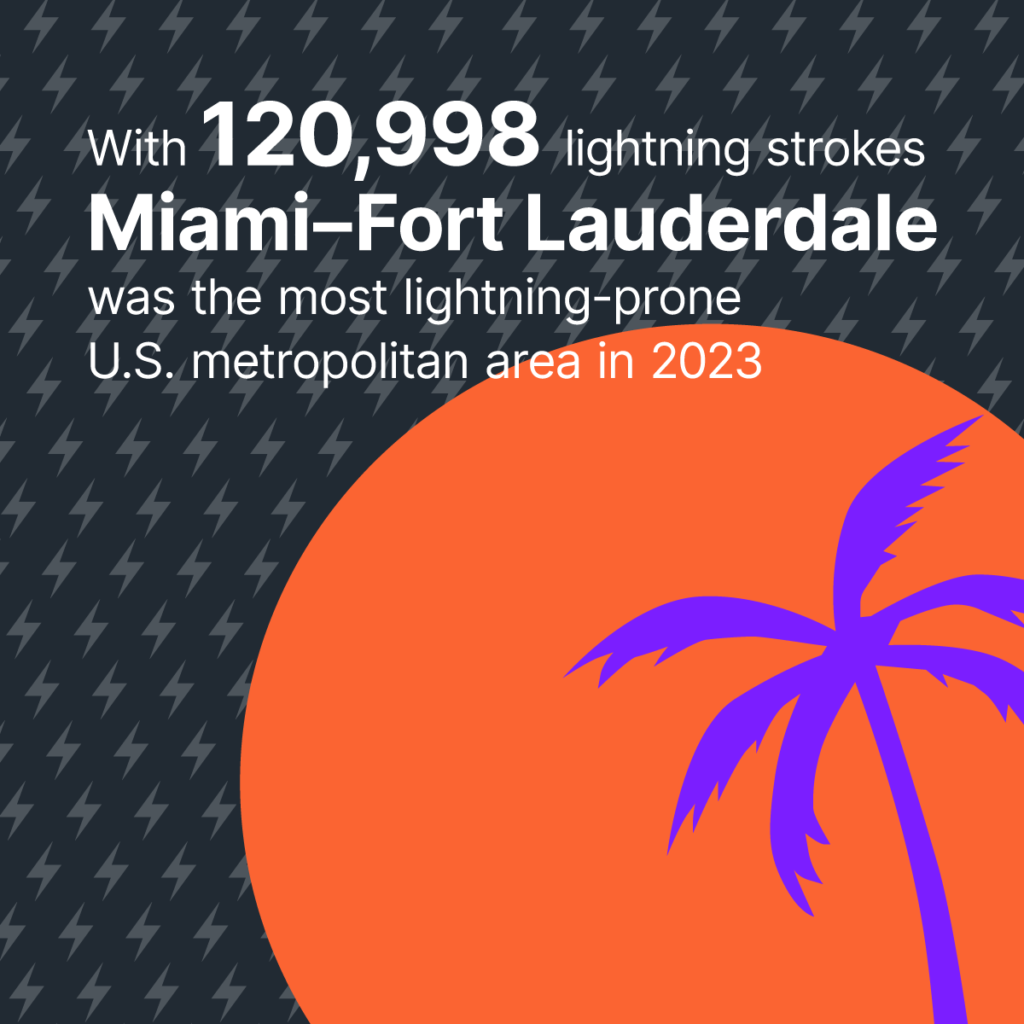
With 120,998 cloud-to-ground lightning strokes – more than 35 per square kilometer – Miami-Fort Lauderdale, Florida, was the most lightning-prone metropolitan area in the USA in 2023.  Houston, Texas, saw 73,114 strokes, followed by Atlanta, Georgia, with 55,490 strokes. The Dallas-Fort Worth-Arlington area in Texas racked up 41,038 strokes. On the East Coast, the New York-Jersey City-Newark metropolitan area in the states of New York and New Jersey had 28,132 lightning strokes.

Altogether, 10 of the most famously tall buildings in the USA were struck by lightning 104 times in 2023. The Willis Tower in Chicago, Illinois, was struck by lightning 38 times. In New York City, One World Trade Center came up second with 26 lightning strikes. In third place was 875 North Michigan Avenue (formerly known as the John Hancock Center), in Chicago, with 15 lightning strikes.

Lightning activity around specific buildings varies considerably from year to year. Chicago has a higher average lightning density than New York City, yet, over the last five years, One World Trade Center was struck by lightning significantly more often than Chicago’s high-rise buildings.

With 42,388,860 lightning events in total, Texas had more lightning than any other state in 2023. When measuring lightning density, however, Florida took the number one spot with 112.6 lightning events per square kilometer.

The data comes from the Vaisala US National Lightning Detection Network (NLDN) and the Vaisala Global Lightning Dataset (GLD360). These two networks detect and pinpoint the location of in-cloud and cloud-to-ground lightning events 24 hours a day. Together, they detect 99.9% of thunderstorms worldwide, recording more than two billion lightning events every year.

Read more of the latest lightning detection updates from the meteorological technology industry, here.

Previous ArticleTomorrow.io to support expansion of multi-hazard early warning systems across Africa
Next Article Spire Global launches 11 satellites

Read Similar Stories

Lightning Detection

Vaisala unveils helideck monitoring software for offshore operations

May 9, 20253 Mins Read
Climate Measurement

Omaha’s National Weather Service office resumes twice-daily balloon launches

May 7, 20252 Mins Read
Climate Measurement

University of Oxford researchers investigate use of seismic signals in volcanic eruption prediction

May 6, 20254 Mins Read
Latest News

WMO and Beijing Climate Centre host climate monitoring and prediction forum in Qingdao

May 16, 2025

Integrated model improves flood risk assessment in China

May 15, 2025

EXCLUSIVE INTERVIEW: Ramla Qureshi, McMaster University’s Department of Civil Engineering

May 14, 2025

Receive breaking stories and features in your inbox each week, for free


Enter your email address:


Supplier Spotlights
  • ZX Lidars
Latest Job Postings
  • Researcher/Engineer to support data-based weather forecasting (R2/RE2)

    • Barcelona
    • Barcelona Supercomputing Center - Centro Nacional de Supercomputación
    • Full Time
Getting in Touch
  • Contact Us / Advertise
  • Meet the Editors
  • Download Media Pack
  • Free Weekly E-Newsletter
Our Social Channels
  • Facebook
  • LinkedIn
© 2025 UKi Media & Events a division of UKIP Media & Events Ltd
  • Cookie Policy
  • Privacy Policy
  • Terms and Conditions
  • Notice and Takedown Policy

Type above and press Enter to search. Press Esc to cancel.

We use cookies on our website to give you the most relevant experience by remembering your preferences and repeat visits. By clicking “Accept”, you consent to the use of ALL the cookies.
Cookie settingsACCEPT
Manage consent

Privacy Overview

This website uses cookies to improve your experience while you navigate through the website. Out of these, the cookies that are categorized as necessary are stored on your browser as they are essential for the working of basic functionalities of the ...
Necessary
Always Enabled

Necessary cookies are absolutely essential for the website to function properly. These cookies ensure basic functionalities and security features of the website, anonymously.

CookieDurationDescription
cookielawinfo-checbox-analytics11 monthsThis cookie is set by GDPR Cookie Consent plugin. The cookie is used to store the user consent for the cookies in the category "Analytics".
cookielawinfo-checbox-functional11 monthsThe cookie is set by GDPR cookie consent to record the user consent for the cookies in the category "Functional".
cookielawinfo-checbox-others11 monthsThis cookie is set by GDPR Cookie Consent plugin. The cookie is used to store the user consent for the cookies in the category "Other.
cookielawinfo-checkbox-necessary11 monthsThis cookie is set by GDPR Cookie Consent plugin. The cookies is used to store the user consent for the cookies in the category "Necessary".
cookielawinfo-checkbox-performance11 monthsThis cookie is set by GDPR Cookie Consent plugin. The cookie is used to store the user consent for the cookies in the category "Performance".
viewed_cookie_policy11 monthsThe cookie is set by the GDPR Cookie Consent plugin and is used to store whether or not user has consented to the use of cookies. It does not store any personal data.

Functional

Functional cookies help to perform certain functionalities like sharing the content of the website on social media platforms, collect feedbacks, and other third-party features.

Performance

Performance cookies are used to understand and analyze the key performance indexes of the website which helps in delivering a better user experience for the visitors.

Analytics

Analytical cookies are used to understand how visitors interact with the website. These cookies help provide information on metrics the number of visitors, bounce rate, traffic source, etc.

Advertisement

Advertisement cookies are used to provide visitors with relevant ads and marketing campaigns. These cookies track visitors across websites and collect information to provide customized ads.

Others

Other uncategorized cookies are those that are being analyzed and have not been classified into a category as yet.

SAVE & ACCEPT
Powered by