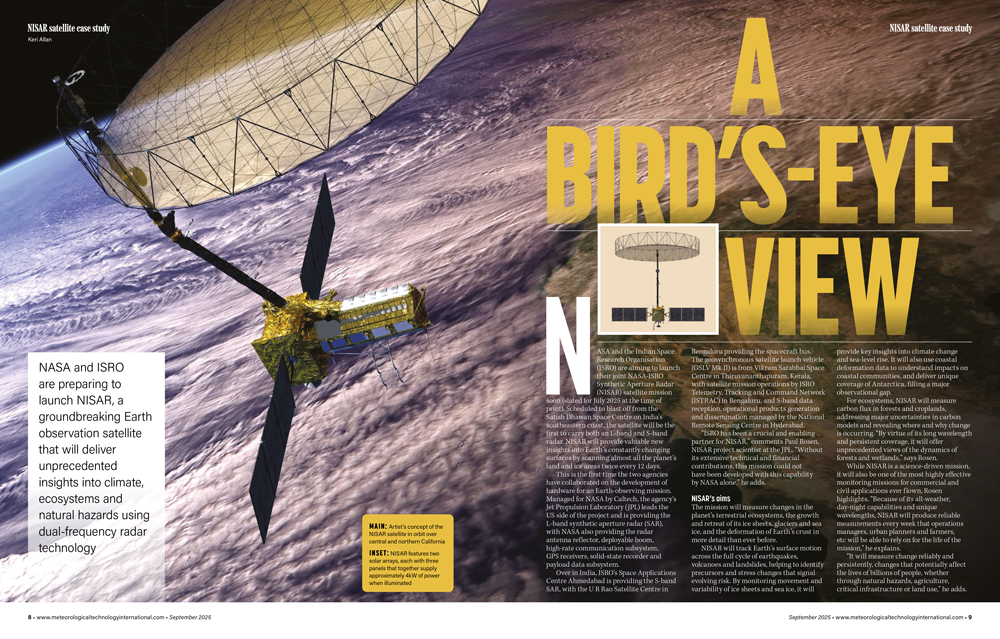


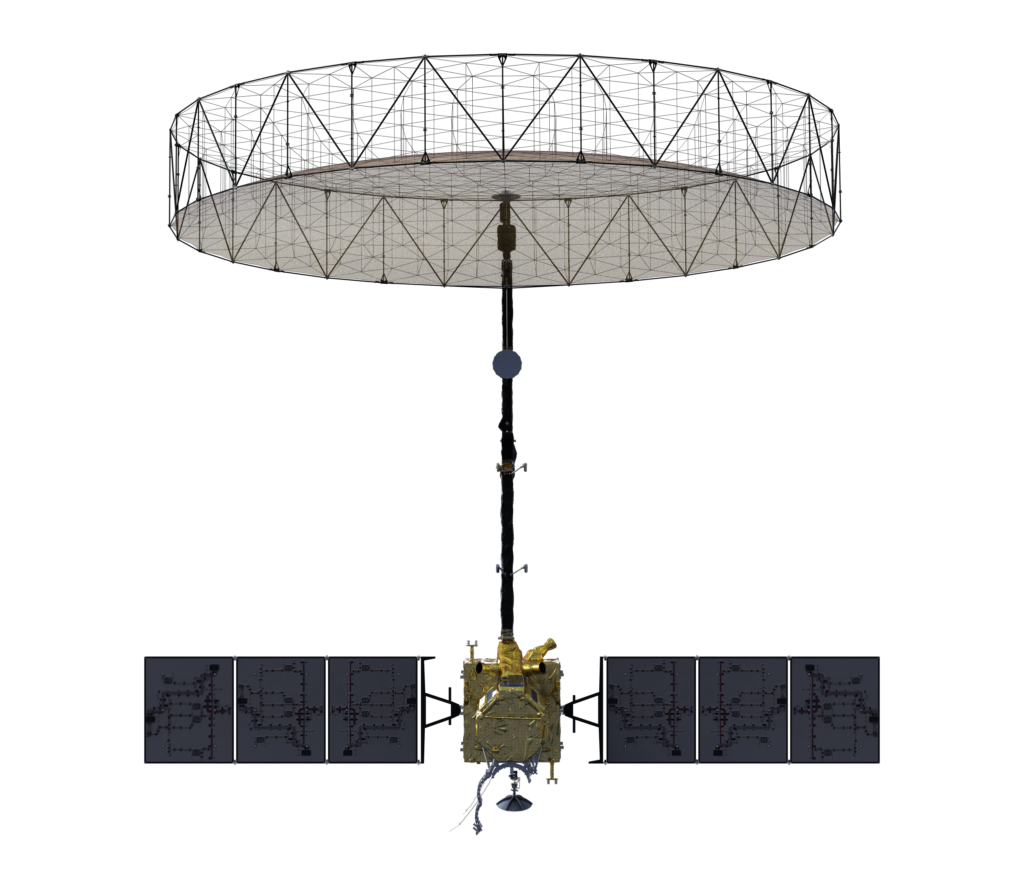
NASA and ISRO are preparing to launch NISAR, a groundbreaking Earth observation satellite that will deliver unprecedented insights into climate, ecosystems and natural hazards using dual-frequency radar technology, writes Keri Allan in the September 2025 issue of Meteorological Technology International
NASA and the Indian Space Research Organisation (ISRO) are aiming to launch their joint NASA-ISRO Synthetic Aperture Radar (NISAR) satellite mission soon (slated for July 2025 at the time of print). Scheduled to blast off from the Satish Dhawan Space Centre on India’s southeastern coast, the satellite will be the first to carry both an L-band and S-band radar. NISAR will provide valuable new insights into Earth’s constantly changing surfaces by scanning almost all the planet’s land and ice areas twice every 12 days.
This is the first time the two agencies have collaborated on the development of hardware for an Earth-observing mission. Managed for NASA by Caltech, the agency’s Jet Propulsion Laboratory (JPL) leads the US side of the project and is providing the L-band synthetic aperture radar (SAR), with NASA also providing the radar antenna reflector, deployable boom, high-rate communication subsystem, GPS receivers, solid-state recorder and payload data subsystem.
Over in India, ISRO’s Space Applications Centre Ahmedabad is providing the S-band SAR, with the U R Rao Satellite Centre in Bengaluru providing the spacecraft bus.
The geosynchronous satellite launch vehicle (GSLV Mk II) is from Vikram Sarabhai Space Centre in Thiruvananthapuram, Kerala, with satellite mission operations by ISRO Telemetry, Tracking and Command Network (ISTRAC) in Bengaluru, and S-band data reception, operational products generation and dissemination managed by the National Remote Sensing Centre in Hyderabad.
“ISRO has been a crucial and enabling partner for NISAR,” comments Paul Rosen, NISAR project scientist at the JPL. “Without its extensive technical and financial contributions, this mission could not have been developed with this capability by NASA alone,” he adds.
NISAR’s aims
The mission will measure changes in the planet’s terrestrial ecosystems, the growth and retreat of its ice sheets, glaciers and sea ice, and the deformation of Earth’s crust in more detail than ever before.
NISAR will track Earth’s surface motion across the full cycle of earthquakes, volcanoes and landslides, helping to identify precursors and stress changes that signal evolving risk. By monitoring movement and variability of ice sheets and sea ice, it will provide key insights into climate change and sea-level rise. It will also use coastal deformation data to understand impacts on coastal communities, and deliver unique coverage of Antarctica, filling a major observational gap.
For ecosystems, NISAR will measure carbon flux in forests and croplands, addressing major uncertainties in carbon models and revealing where and why change is occurring. “By virtue of its long wavelength and persistent coverage, it will offer unprecedented views of the dynamics of forests and wetlands,” says Rosen.
While NISAR is a science-driven mission, it will also be one of the most highly effective monitoring missions for commercial and civil applications ever flown, Rosen highlights. “Because of its all-weather, day-night capabilities and unique wavelengths, NISAR will produce reliable measurements every week that operations managers, urban planners and farmers, etc will be able to rely on for the life of the mission,” he explains.
“It will measure change reliably and persistently, changes that potentially affect the lives of billions of people, whether through natural hazards, agriculture, critical infrastructure or land use,” he adds.
Simultaneous L- and S-band scanning
NISAR uses a first-of-its-kind reflector-feed aperture system that is essentially 72 individually addressable radars that are digitally combined to create two radars with a very wide imaging area with fine resolution and polarimetric capability.
“This means we make no compromise between coverage and image quality, as is typically the case with synthetic aperture radar systems,” says Rosen. “NISAR’s unique design led to other innovations in the size of the onboard data system, the downlink system and the ground network, to handle the prodigious amount of data the instruments produce.
Its reflector-feed aperture is very compact, which enabled two powerful radars to be implemented in a relatively small volume, allowing the first-of-a-kind simultaneous measurements at L- and S-band.”
By using both L- and S-band radar at the same time, NISAR clears up an age-old problem: when you compare radar images taken at different times and frequencies, it’s hard to tell if what you’re seeing is an actual change on the ground or just the surface reacting differently to each radar type. NISAR gets around that by collecting both sets of data at once – so any difference in the images is down to how the ground responds to each wavelength, not because something changed in the meantime.
S-band radar picks up smaller surface details such as leaves, rocks and moisture, while L-band radar can see deeper, through things like vegetation or even ice. By combining both, scientists can get a much clearer picture of what’s really going on.
NISAR’s resolution is approximately 200-2,000 times finer than that of NASA’s Soil Moisture Active Passive (SMAP) satellite (dependent on location) for example, enabling the scientists to see human-sized features. It’s also capable of collecting more data in one 12-day global map than NASA’s Uninhabited Aerial Vehicle Synthetic Aperture Radar (UAVSAR) has collected since it started flying more than 15 years ago.
“UAVSAR is an airborne platform, with limited global reach and coverage. Other missions like the ocean monitoring Seasat and Spaceborne Imaging Radar-C (SIR-C) were also limited in time and global coverage, so NISAR will be unprecedented for NASA in terms of its spatial and temporal coverage,” adds Rosen.
To capture the changes across Earth’s surface, NISAR will operate in a 12-day sun-synchronous orbit, enabling consistent, repeat imaging of every location at the same time of day. “We can design the orbit to have a specified number of days in its repeat cycle, but the spacing of the orbit tracks on Earth will differ for different repeat cycles. If the repeat cycle is too fast – say eight days – then the track spacing will be too wide and we’ll need to design a radar with a very wide swath so we can cover the whole Earth in that number of days,” explains Rosen.
“If the repeat cycle is slower – say 12 days – we can build a smaller radar with a more limited swath. The NISAR team spent much time optimizing the radar size and the repeat cycle, and settled on 12 days, which captures the key timescales of change for our mission, i.e. sub-seasonal, slower change,” Rosen adds.
Resolution varies depending on the area of interest and therefore the radar mode chosen. It’s fixed at 6m and 8m along the orbit path and selectable between 3m and 50m across-track. NISAR can measure Earth’s surface motion at millimeter- to centimeter-level accuracy. “This can lead to millimeter-per-year measurement of ground subsidence, plate motion, volcanic surface motion and the like,” notes Rosen. “It can also measure changes in forest biomass to better than 20 megagrams per hectare.”
An international partnership
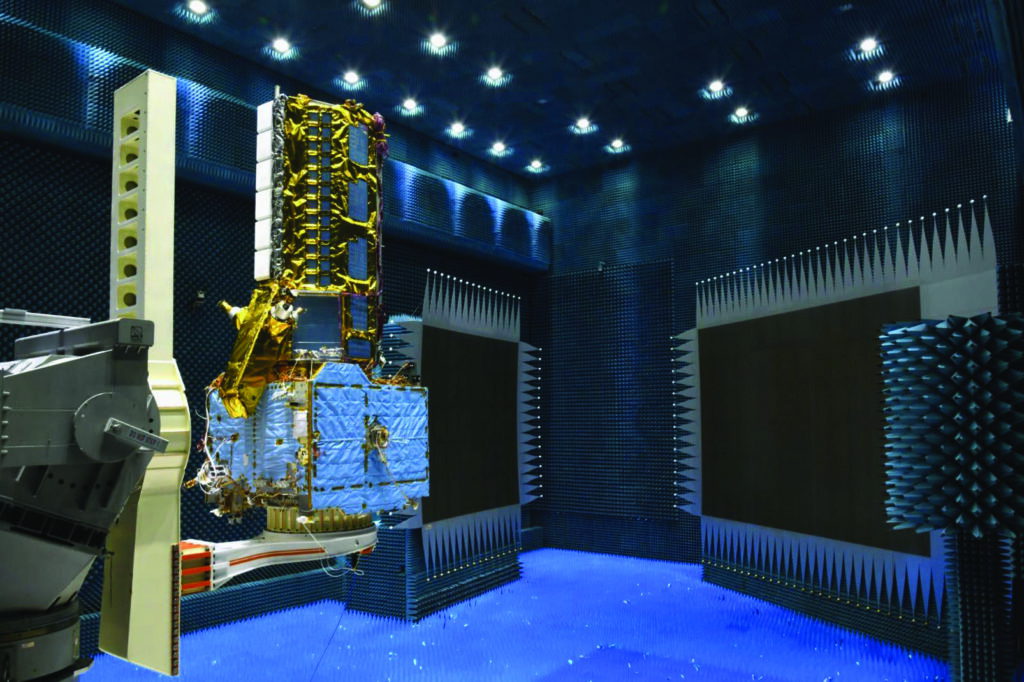
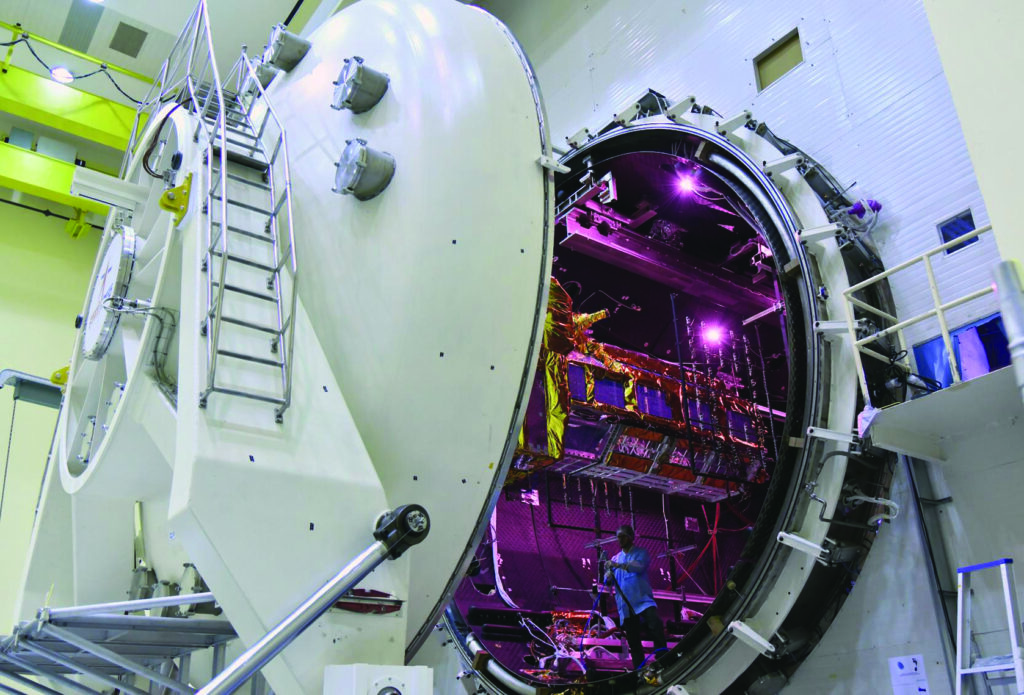
The design of NISAR was a considerable challenge, according to Rosen, as the two radars were built by independent teams at different organizations but had to be physically integrated onto the same platform and made electrically compatible. “This meant that all the technical specifications must be very carefully defined, tracked and tested so that the system works as a single observatory.
“Because the wavelengths are large and therefore the systems are physically large, with hundreds of cables connecting hundreds of electronics boxes, as the system grew in integration, the complexity of managing all the interfaces and testing grew. However, the team met the challenge to deliver a truly integrated system,” he says proudly.
“To be sure, developing complex and physically large hardware on opposite sides of the world through a global pandemic had its challenges, but it’s been an exciting and rewarding experience,” Rosen adds.
Next steps
NISAR’s first data transmissions should occur roughly 22-25 days after launch, with first usable scientific data anticipated after 75-90 days. The plan is to enter routine science operations 90 days after launch and refine the calibration over the next five months, notes Rosen. Data will be available at the Alaska Satellite Facility Distributed Active Archive Center through the Vertex web portal, which will enable users to choose particular data products, timespans and geographic areas.
“NISAR has been a dream of mine and my colleagues since the 1990s, when we first realized the potential of these kinds of measurements. The sheer volume and reliability of global time-series data for so many scientific fields is going to be eye-opening. That the radar design is the first of its kind adds an extra degree of excitement and anticipation at seeing the first images roll off the production line, so to speak,” Rosen enthuses. “Nobody’s seen anything like NISAR before. Though there is plenty of SAR data in the world, in my discussions with colleagues I don’t think they’ve wrapped their heads around just how much better their scientific lives will be with data that
is reliable and persistent everywhere.
“It will be like going from trying to understand a story with half the pages randomly missing from a book, to one where all the pages are there. I think the degree of facility and ease, and the pace of research, will increase dramatically and surprise many,” he concludes.
Untapped radar potential
Scientists at Penn State University in the US have been working to maximize the use of existing radar data to help predict the height of the planetary boundary layer and, in turn, improve severe weather forecasts.
“When the US Weather Service upgraded its Doppler radar capabilities to dual polarization it hugely improved precipitation estimation. But with the new sensitivity we were also able to see the top of the boundary layer – something that wasn’t expected,” explains Prof. David Stensrud from Penn State’s Department of Meteorology and Atmospheric Science. “While they weren’t designed for that purpose, it’s an ancillary benefit that’s yet to be fully explored,” he adds.
Knowing the height of the boundary layer can help weather forecasters better understand surface moisture, instability and storm potential. These more accurate observations can be added to numerical weather prediction (NWP) models using data assimilation, correcting model errors and leading to improved rainfall predictions, storm intensity estimates and earlier weather warnings, especially in fast-changing daytime conditions.
Stensrud and his research colleagues applied the model to weather forecasts from a series of overnight storms in July 2022 that brought heavy rain and flooding to eastern Kentucky. “We saw that assimilating boundary-layer observations into the model made a significant difference. The standard model predicted a boundary layer that was too deep, which lowered moisture levels and reduced storm intensity. By using radar-based observations to correct that – making the layer shallower – we increased the available moisture and instability in the atmosphere. That gave storms more energy and produced stronger updrafts.
“As a result, the forecast improved across all key metrics: rainfall location, intensity and total accumulation over the 12-hour period were all much closer to what actually occurred,” Stensrud continues.
Stensrud and his colleagues are still in the early stages of research into the potential use of boundary-layer height data, but initial results show that its assimilation into models could improve forecasts for various weather events, including cyclones. “We’re now working to better understand these observations. The data already exists, but we need to refine how it’s used and automate quality control for operational forecasting. While the goal is to integrate this into operational weather models, we’re focused on validating it and improving the reliability of the observations first,” he concludes.
This article was first published in the September 2025 issue of Meteorological Technology International magazine. See our full magazine archive of previous issues here, and subscribe to receive future issues here